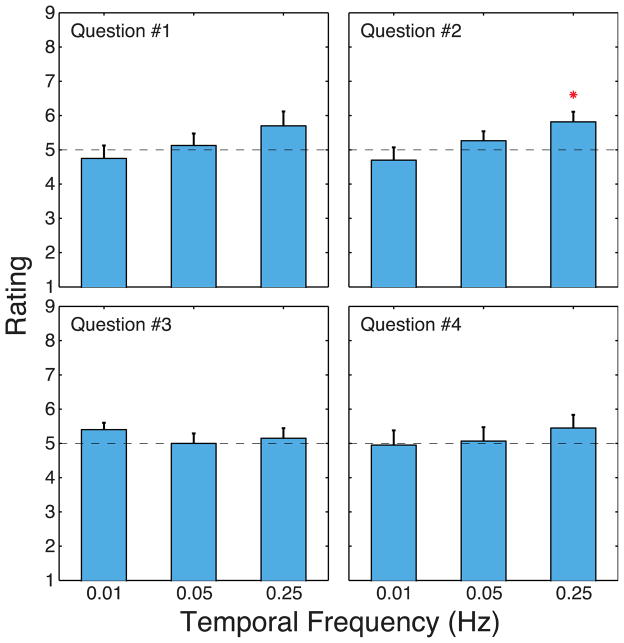
Figure 9.
Results from the session-comparison questionnaire averaged across subjects. Ratings are plotted for each question and experimental condition. Ratings greater than 5 indicate that the natural condition was preferred to the conflict condition. Red, green, and blue represent respectively temporal frequencies of 0.01, 0.05, and 0.25Hz. Lighter colors represent the natural-viewing condition and darker colors the conflict condition. Question 1 concerned eye fatigue, question 2 concerned eye irritation, question 3 concerned how the head felt, and question 4 asked which session the subject preferred. Red asterisks indicate statistically significant differences between natural and conflict viewing (p<0.05, two-tailed Wilcoxon signed rank test).

