
Fig. 3.
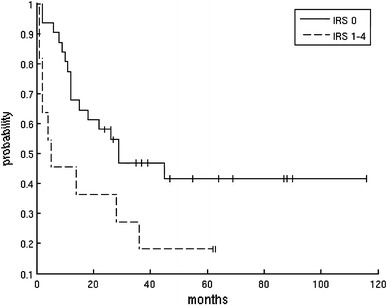
Kaplan–Meier curve for two groups of patients: solid line, VEGF-D expression (Immuno Reactive Score, IRS) = 0; dashed line IRS = 1–4)
Official websites use .gov
A
.gov website belongs to an official
government organization in the United States.
Secure .gov websites use HTTPS
A lock (
) or https:// means you've safely
connected to the .gov website. Share sensitive
information only on official, secure websites.
Kaplan–Meier curve for two groups of patients: solid line, VEGF-D expression (Immuno Reactive Score, IRS) = 0; dashed line IRS = 1–4)