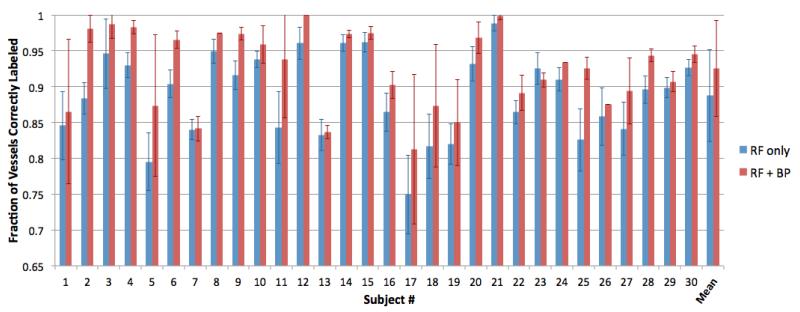
Figure 2.
Fraction of vessels correctly labeled, averaged across 10 experiments for each subject. Blue columns are the results of the random forest classifier (RF), and red columns show the results of RF followed by belief propagation (RF+BP). The right-most column pair is the average correct labeling rates across all 30 ± 10 = 300 experiments.

