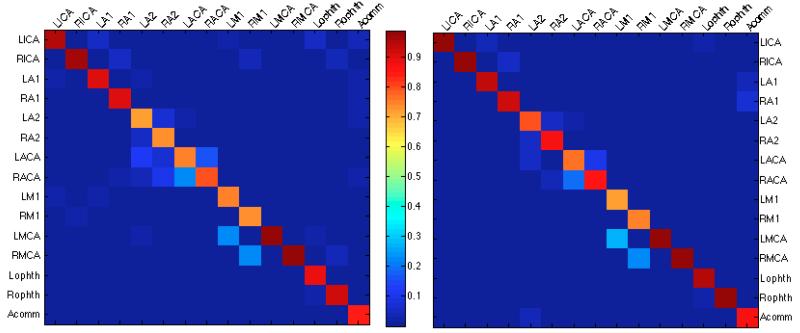
Figure 3.
Confusion matrices for the RF only method (left) and RF+BP (right) for all vessel segments across 30 subjects. True labels are on the horizontal axis, and the predicted labels on the vertical axis. The values presented in the matrices are fraction of vessels with true label x that were assigned label y (i.e. values in each column add up to 1).

