Figure 6.

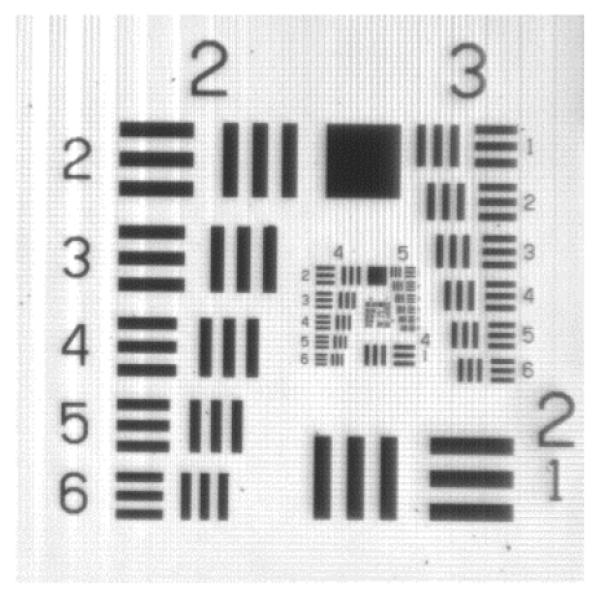
Image of a 1951 USAF resolution test chart target. Horizontal and Vertical line pairs are both clearly visible in Group 5, Element 1, indicating an imaging resolution of 27.8 μm.

Image of a 1951 USAF resolution test chart target. Horizontal and Vertical line pairs are both clearly visible in Group 5, Element 1, indicating an imaging resolution of 27.8 μm.