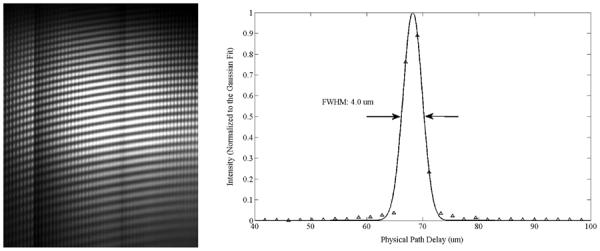
Figure 9.

Left. Spectral interferogram using mirrors in the reference and sample arms of the interferometer with a physical path delay of 68 μm. The optical wavelength and lateral position on the target proceed along the y-axis and x-axis, respectively. The DLP strips are shown as circular spots proceeding left-to-right with the rolling shutter.
Right. The axial point spread function of the OCT system using a DLP source, with 4.0 μm depth resolution.
