
Fig. 2.
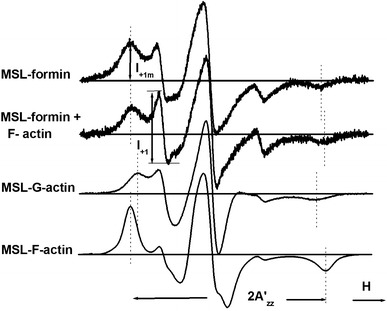
Upper 2 spectra: conventional EPR spectra of MSL–formin and its complex with F-actin. Lower 2 spectra: conventional EPR spectra of MSL–G-actin and MSL–F-actin. In contrast with MSL–F-actin, the spectra of MSL–formin contain two components with different rotational mobility. The peak heights of the low-field components are labeled I +1 and I +1m