Fig. 5.

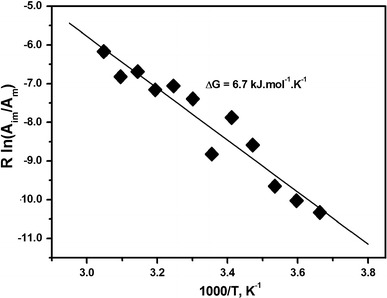
Van’t Hoff plot for the double integral ratio of the first two components in the spectrum of MSL–formin. From the slope of the straight line the free energy change (ΔG) was determined to be 6.7 kJ mol−1 K−1

Van’t Hoff plot for the double integral ratio of the first two components in the spectrum of MSL–formin. From the slope of the straight line the free energy change (ΔG) was determined to be 6.7 kJ mol−1 K−1