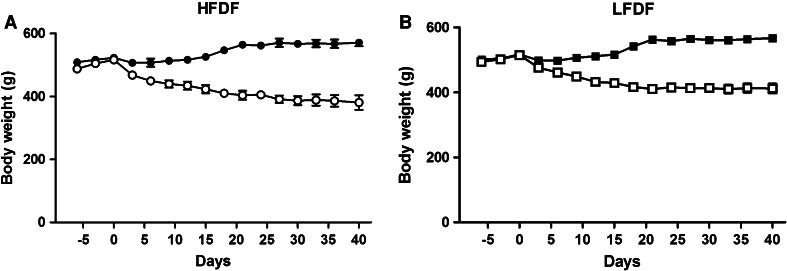
Fig. 2.
Body weight plots of the A HFDF groups (HFDF-SH: n = 5, filled circles, HFDF-GB: n = 5, empty circles) and the B LFDF groups (LFDF-SH: n = 6, filled squares, LFDF-GB: n = 8, empty squares) throughout the study. Data are presented as mean ± standard error of the mean. HFDF high-fat diet fed, LFDF low-fat diet fed, SH sham procedure, GB gastric bypass

