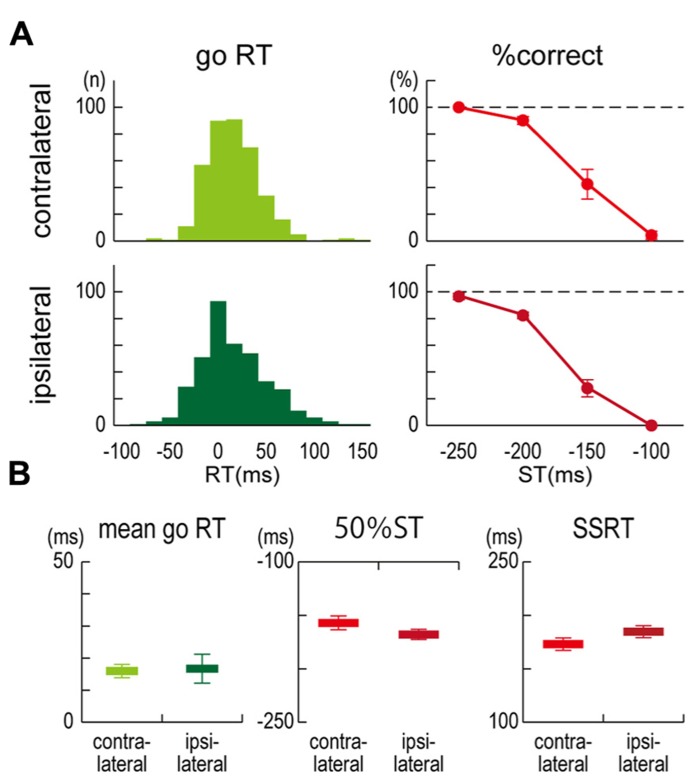
FIGURE 2.
Task performance.(A) Distributions of response time (RT) in go trials without TMS and the percentage of correct responses (% correct) in stop trials without TMS for each stop time (ST) that was obtained from six participants in contralateral (upper) and ipsilateral (lower) TMS conditions. RT denotes a clicking time relative to the target. (B) Group results of mean go RT (left), estimated 50% STs in stop trials (center), and stop-signal reaction times (SSRTs) in stop trials (right). The 50% ST is an estimated stop time in which the probability of successful stopping was 50%. SSRT is the estimated time required for an unobservable stop process. Error bars show standard error (SE).

