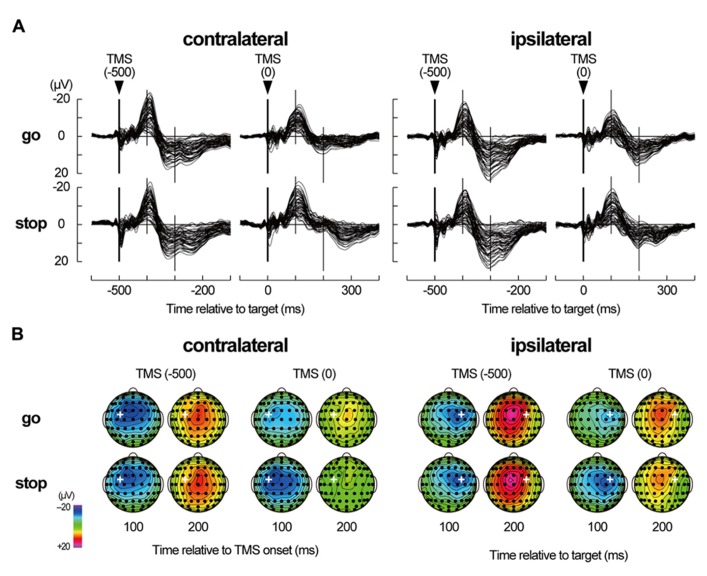
FIGURE 5.
TMS-evoked potentials. (A) TMS-evoked potentials (TEPs) during go/stop task with TMS at -500 and 0 ms for six participants in a contralateral-TMS session (left 2 × 2 panels) and with TMS at -500 and 0 ms for six participants in an ipsilateral-TMS session (right 2 × 2 panels). The vertical thick lines represent TMS onset, and the vertical thin lines represent 100 and 200 ms after the TMS onset. Time scales relative to target are displayed at the bottom. (B) The scalp topographies of TEPs in the go and stop trials for six participants in a contralateral-TMS session (two left 2 × 4 arrays) and for six participants in an ipsilateral-TMS session (two right 2 × 4 arrays). The bold white plus in each topography represents the TMS sites. The topographies are displayed only at 100 and 200 ms relative to TMS onset, corresponding approximately to N100 and later positive component (LPC), respectively.

