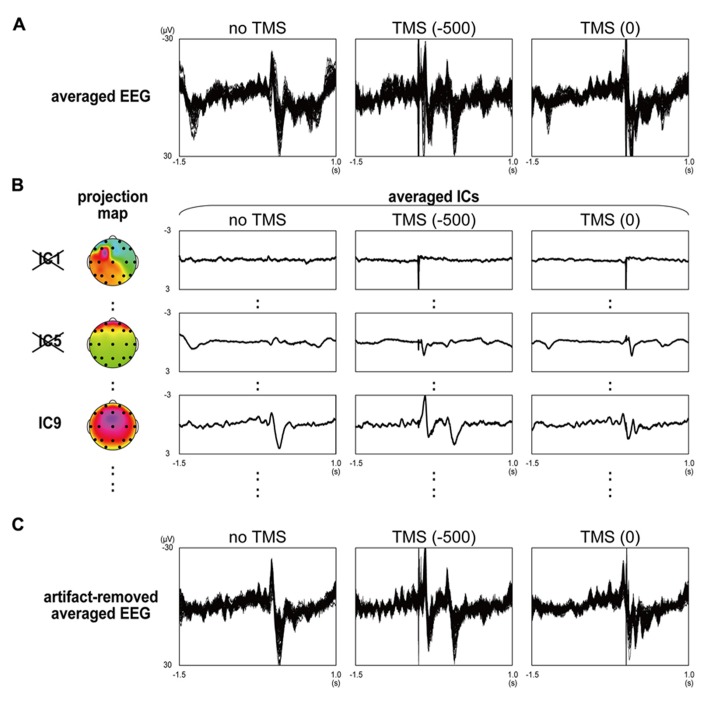
Figure A1.
Artifact rejection from TMS-EEG data by using independent component analysis in a typical participant. (A) Averaged EEG waveforms in no-TMS stop trials (left panel), stop trials with contralateral-TMS at -500 and 0 ms (middle and right panels) recorded from 61 surface electrodes. (B) Averaged independent component (IC) waveforms and their projection maps in no-TMS stop trials (left panel), stop trials with contralateral-TMS at -500 and 0 ms (middle and right panels) extracted from 61 EEG waveforms. In order of their variance size, the largest component (IC1), fifth largest component (IC5), and ninth largest component (IC9) were selectively shown. (C) Artifact-removed averaged EEG waveforms in no-TMS stop trials (left panel), stop trials with contralateral-TMS at -500 and 0 ms (middle and right panels).

