Abstract
Background
Type II diabetes has become a serious threat to human health in recent years. Among adults above 20 years old in China, the prevalence rate of diabetes is 9.7%. Thus, it is imperative to study the mechanisms underlying type II diabetes to develop effective therapeutic treatments.
Objective
To examine metabolic changes in a rat model of type II diabetes and explore mechanisms underlying the beneficial effects of traditional Chinese medicine (TCM) in this model. 120 rats were divided into four groups, including a control group, a high-fat diet group (high-fat diet and streptozotocin injection), a TCM group (high-fat diet, streptozotocin injection, followed by TCM administration), and a rosiglitazone maleate group (high-fat diet, streptozotocin injection, followed by rosiglitazone maleate administration). Metabolites in urine samples from 1–3 weeks (time point 1) and 4–6 weeks (time point 2) of drug administration were compared by gas chromatography-mass spectrometry (GC-MS).
Results
Our results showed that in the high-fat diet group, at time point 2, the levels of dihydroxybenzoic acid, L-ascorbic acid, D-gluconic acid, octadecanoic acid, and glutaric acid in urine were significantly higher than at time point 1. In the TCM group, at time point 2, the urine levels of L-ascorbic acid were markedly lower than at time point 1.
Conclusion
Our studies demonstrated that examining urine metabolic changes provided important insights into the mechanisms underlying type II diabetes as well as the therapeutic effects of TCM.
Keywords: Type II diabetes, Urine metabonomics, Traditional Chinese Medicine, Rat Model
Introduction
Type II diabetes has become a serious threat to human health in recent years. Among adults above 20 years old in China, the prevalence rate of diabetes is 9.7% (male: 10.6%; females: 8.8%). The average onset age has also decreased significantly1. Thus, it is imperative to study the mechanisms underlying type II diabetes to develop effective therapeutic treatments.
Metabonomics, the study of metabolites and their roles in various disease states, is a novel methodology arising from the post-genomics era. In the last decade, “metabonomics” had demonstrated enormous potential in further detecting and comprehending the aetiopathogenesis of many diseases, including cardiovascular disorders and diabetes2. Metabonomics is now recognized as an independently and widely used technique for deriving new biochemically based assays for disease diagnosis, understanding the relationships between gene function and metabolic control in health and disease, and identifying combination biomarkers for disease3. Nowadays Gas Chromatography (GC) is playing an important role in the metabonomics research. 4, 5 Type II diabetes (DM2) is a typical metabolism disorder disease with the very high frequency of 1.5–2.5% in the Western hemisphere. Some of the changes in the concentrations of the metabolites are detectable in blood serum and in urine even when the diabetic patients are well controlled by therapy. These alterations are therefore inherently associated with the disease. GC analysis has revealed a number of path physiological changes to accompany diabetes mellitus.
Traditional Chinese medicine (TCM) has been widely used to treat type II diabetes 6, 7. Both clinical and animal studies have provided important evidences 8.
This study established a rat model of type II diabetes in which rats were fed with high-fat diet for 6 weeks and then received intraperitoneal injection of streptozotocin, an inducer of diabetes. Then we employed gas chromatography-mass spectrometry (GC-MS) to explore metabolite changes in the urine. We also examined that how administration of TCM affects metabolites in the urine. Metabonomics revealed a dynamic metabolic fingerprint in urine or blood samples, and thus could provide important details in the metabolic spectrum with TCM intervention.
Methods
Animals
A total of 120 8-week male Sprague Dawley (SD) rats, weighting 220 ± 10 g, were purchased from Vital River Lab Animal Technology Co., Ltd., Beijing, China. Rats were kept in the animal center of Beijing University of Chinese Medicine under standard conditions (room temperature: 18–25°C, relative humidity: 50–60%). Rats were habituated to the environment for 1 week before the operation.
Food
Regular and high-fat rat foods were purchased from Institute of Zoology, Chinese Academy of Sciences. High-fat feed was composed of (by weight) 20% lard, 10% sucrose, 23% casein, 0.3% methionine, 28% starch, 10% dextrin, 7.5% cellulose, 0.3% choline, 0.1% multi-vitamin premix, and 0.8% multi-mineral premix.
Chinese herbal formula
The Chinese herbal formula was composed of Chinese 24g atractylodes rhizome, 24g largehead atractylodes rhizome, 12g skullcap, and 12g salvia, and was provided by Beijing University of Chinese Medicine prepared the herbs from the effective fraction, extracted by water and then extracted by ethanol, followed by the strict standards. The Chinese herbal formula was kept at 4°C. Rats in the TCM group were given oral garage of 1 g/mL once daily at 8 am. Rats in the western medicine group were given oral garage about rosiglitazone maleate tablets (Glaxosmithkline Holdings Inc.) ( dissolved at 0.2 mg/mL) once daily at 8 am. The dose for the experimental study was calculated by considering seven times clinical dose and its conversion to rat dose was on the basis of body weight.
The four herbs were collected from TCM experts' common view. They were authenticated by Professor Guijun Zhang from Beijing University of Chinese Medicine.
Reagents
Streptozotocin was purchased from Beijing Bangding Taike Biotechnology Co., Ltd., China. Acetonitrile (A996-4) was purchased from Fisher Scientific, USA. Pyridine (110-86-1) and chloroform (67-66-3) were from Mreda Technology Inc. USA, 17 carbon fatty acid (H3500-5G), trimethylchlorosilane (386529), and N-methyl-N-(trimethylsilyl)trifluoroacetamide (394866) were purchased from Sigma, USA.
Equipment
Trace 2000/Trace DSQ gas chromatography-mass spectrometer was purchased from Finnigan, USA.
High-fat diet model and medical treatment
In the high-fat diet group, rats were fed with high-fat food for 6 weeks, and then received intraperitoneal injection of streptozotocin (35 mg/kg). In the control group, rats were fed with normal diet for 6 weeks, and then received intraperitoneal injection of 0.1M citric acid-sodium citrate buffer (same dose). Four weeks after streptozotocin or buffer injection, the plasma glucose level in tail vein blood was tested in both groups. Only rats with fasting blood glucose levels > 11.1 mmol/L were included in the study 9.
A total of 59 rats underwent high-fat diet reached the above standard. The rats were randomly divided into four groups: a TCM group, a rosiglitazone maleate group, a high-fat diet group, and a control group. Rats in the TCM group received 4 mL of traditional Chinese formula by oral garage. Rats in the rosiglitazone maleate group received 1 mL of rosiglitazone maleate by oral garage. Rats in both the high-fat diet group and the control group received water by oral garage. For all the rats, oral garage was performed once daily at 8 am and lasted for 6 weeks.
Urine collection
During the 6 weeks of drug intervention, 24-h urine samples were collected from the TCM group, rosiglitazone maleate group, high-fat diet group, and control group once every weekend. Urine samples were collected from eight rats per group randomly, with 1 mL of urine per rat, and were stored at 80°C. Urine samples from the first 3 weeks were grouped as time point 1, and the last 3 weeks, time point 2. Since Type 2 diabetes is a kind of metabolic disorder, the urine is an important biological fluid to study the metabolite change of the disease.
Gas chromatography-mass spectrometry
600 ìL of urine samples was mixed with 10µL of internal standard (6 mg/mL of 17 carbon fatty acids) and 400 µL of acetonitrile, vortexed for 1 min, sonicated in an ultrasonic ice-bath for 10 min, and centrifuged for 5 min at 18,000 r/min, 4°C. The supernatant was transferred to a clean tube, dried by nitrogen, mixed was 50 µL of methoxyamine pyridine solution (15 mg/mL), and incubated at 30°C for 2 h. 50µL of derivatization reagent (N-methyl-N-trimethylsilytrifluoroacetamide:trimethylchlorosilane = 100:1, v/v) was added and the solution was stratified for 1 h. The supernatant was transferred into a micro sample tube for GC-MS analysis 10.
The parameters of GC-MS analysis were set as follows. Split ratio: 1:1; injection volume: 0.5 µL; injection port temperature: 280°C; and interface temperature: 250°C. The temperature program was adjusted as follows: first kept for 2 min at 80°C, increased to 140°C at 10°C/min, increased to 240°C at 4°C/min, increased to 280°C at 10°C/min, and finally kept at 280°C for 3 min. Ion source temperature: 200°C; carrier gas: high purity helium; helium gas flow rate: 1.0 mL/min; ionization mode: election impact; electron energy: 70 eV; and scan range: 50–800 m/z 11.
Metabolite levels were reflected by the peak area ratios of the analyte to internal standard in the total ion flow diagram 12.
Statistical analysis
Data were analyzed by principal component analysis (PCA) by SIMCA-P+ software (PCA principal component analysis and PLS-DA. version 12.0.1, Umetrics, Sweden). The basic statistics was performed by using SPSS 17.0 Version. The significance P<0.05 was computed by using Independent t test between two groups.
Results
Total ion flow diagram
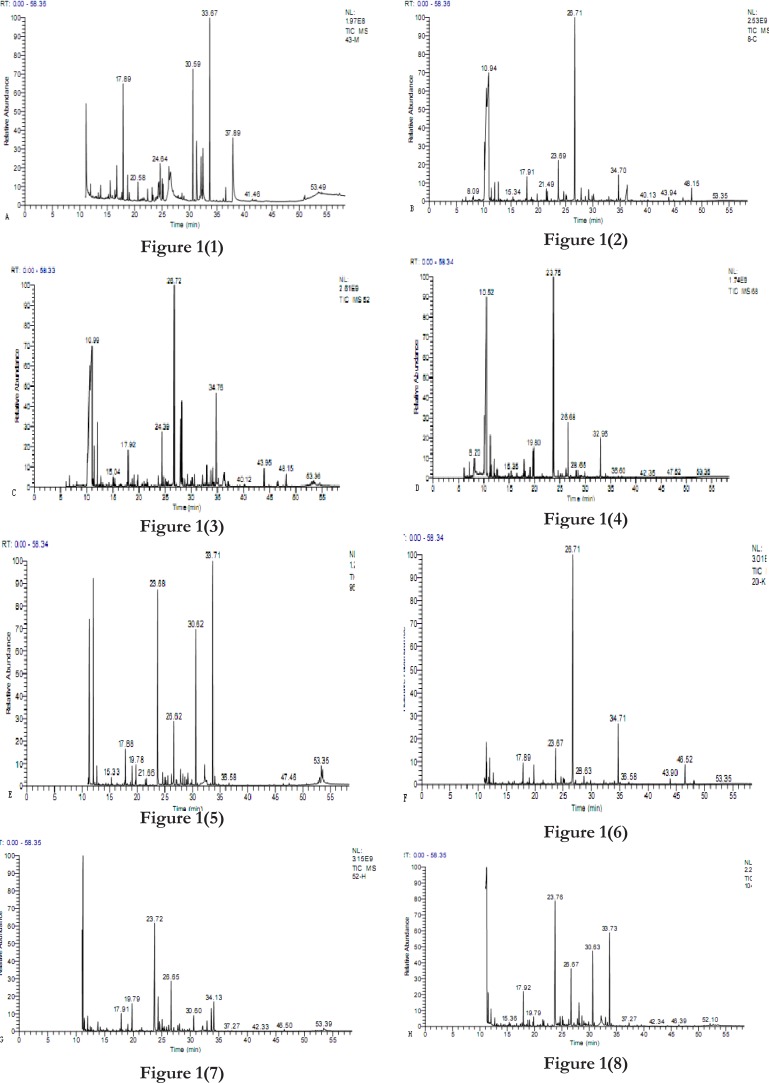
The total ion flow diagram of the TCM group, rosiglitazone maleate group, high-fat diet group, and control group from time points 1 to 2 are shown in figure 1.
Figure 1.
Total ion flow diagram.
Time point 1: TCM group (A), rosiglitazone maleate group (B), high-fat diet group (C), and control group (D).
Time point 2: TCM group (E), rosiglitazone maleate group (F), high-fat diet group (G), and control group (H).
Figure 1.
Metabolite analysis
A total of nine endogenous metabolites were identified in the urine samples with match factors greater than 80% in the National Institute of Standards and Technology mass spectral database. Based on the retention time, these nine metabolites contained alanine, dihydroxybenzoic acid, glutaric acid, L-ascorbic acid, D-gluconic acid, palmitic acid, octadecanoic acid, and glycerol (table 1).
Table 1.
Urine metabolite analysis by GC-MS
| # | Retention | Match | Compound | Potential Metabolite |
| Time | Factor | |||
| (%) | ||||
| 1 | 14.97 | 86.55 | Alpha-Alanine,N,N-bis(trimethylsilyl)-, trimethylsilyl ester | Alanine |
| 2 | 15.33 | 85.96 | (R*,S*)-3,4-Dihydroxybutanoic acid tri TMS | Dihydroxybenzoic acid |
| 3 | 19.77 | 91.41 | Pentanedioic acid,2-[(trimethylsilyl)oxy]-, | Glutaric acid |
| bis(trimethylsilyl)ester | ||||
| 4 | 29.84 | 92.28 | L-Ascorbic acid, 2-O-methyl-3,5,6-tris-O-(trimethylsilyl)- | L-ascorbic acid |
| 5 | 32.16 | 94.33 | L-Ascorbic acid,2,3,5,6-tetrakis-O-(trimethylsilyl)- | L-ascorbic acid |
| 6 | 33.23 | 88.37 | D-Gluconic acid,2,3,4,5,6-pentakis-O-(trimethylsilyl)-, | D-gluconic acid |
| trimethylsilyl ester | ||||
| 7 | 34.3 | 91.49 | Hexadecanoic acid,trimethylsilyl ester | Palmitic acid |
| 8 | 40.09 | 93.38 | Octadecanoic acid,trimethylsilyl ester | Octadecanoic acid |
| 9 | 50.96 | 92.15 | 1-Monolinoleoylglycerol trimethylsilyl ether | Glycerol |
Treatment comparisons: high-fat diet
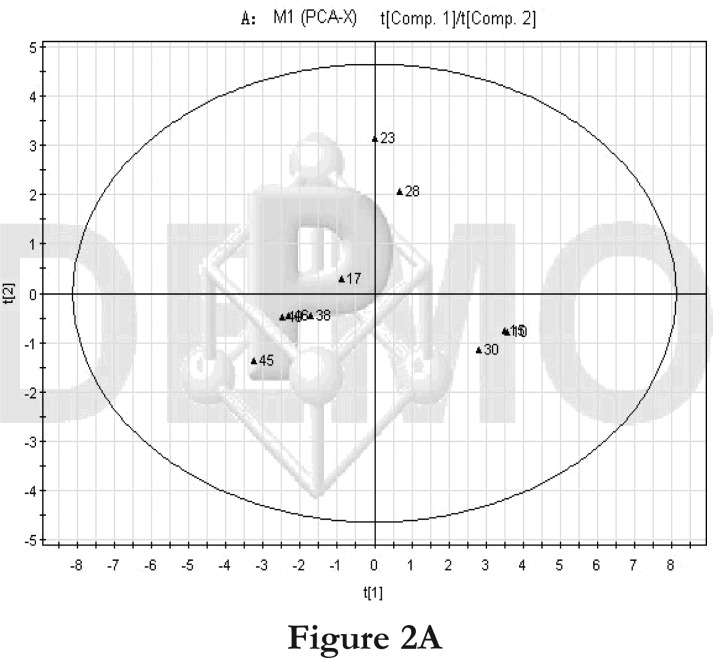
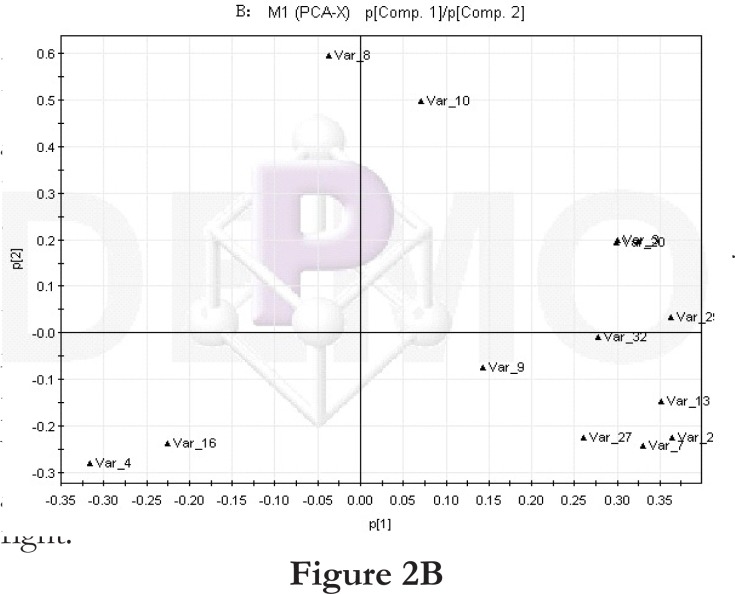
We first compared the time points 1 and 2 of the high-fat diet group. The PCA score plot (Figure 2A) and loading diagram (figure 2B) showed that the two groups (time points 1 and 2) separated from each other along the t1 axis (except for the first sample of time point 1). The first two principal components could explain 67.2% of the total variance, and the first four principal components explained 85.7% of the total variance, covering most of the metabolite information. The PCA score plot of the first two principal components demonstrated that the samples were distributed in two regions, with time point 1 samples on the left and time point 2 samples on the right.
Figure 2.
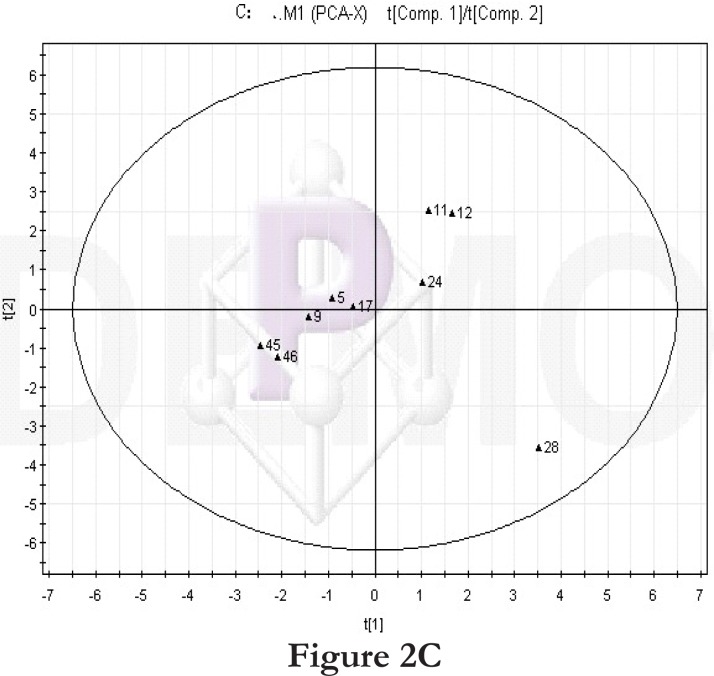
PCA score plot and loading diagram.
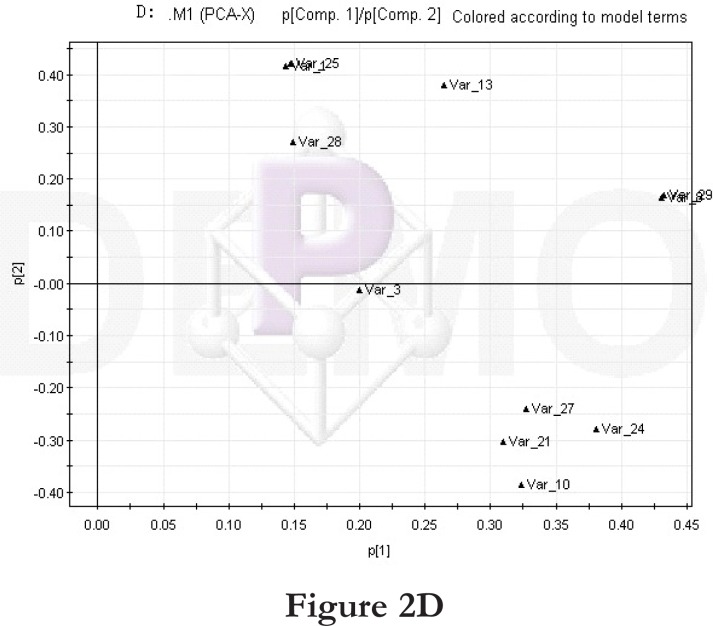
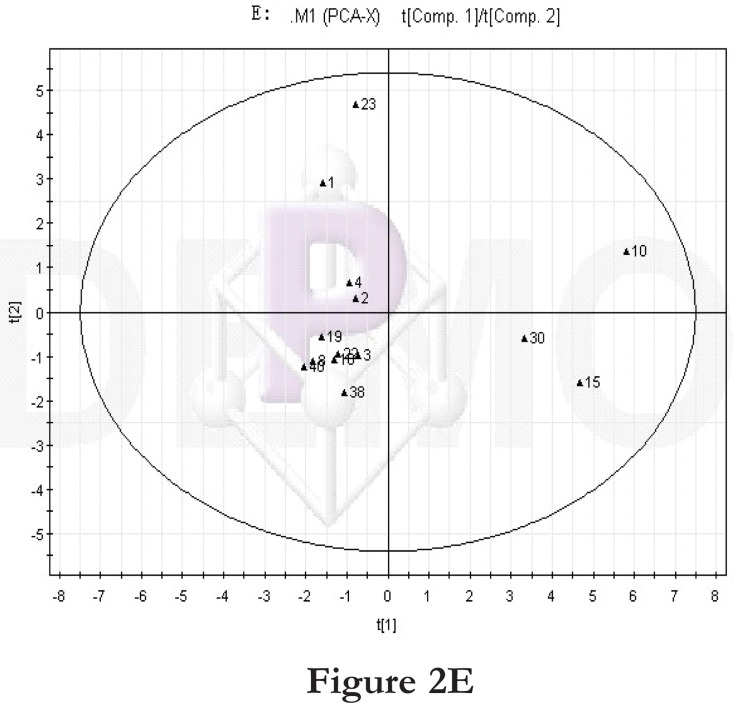
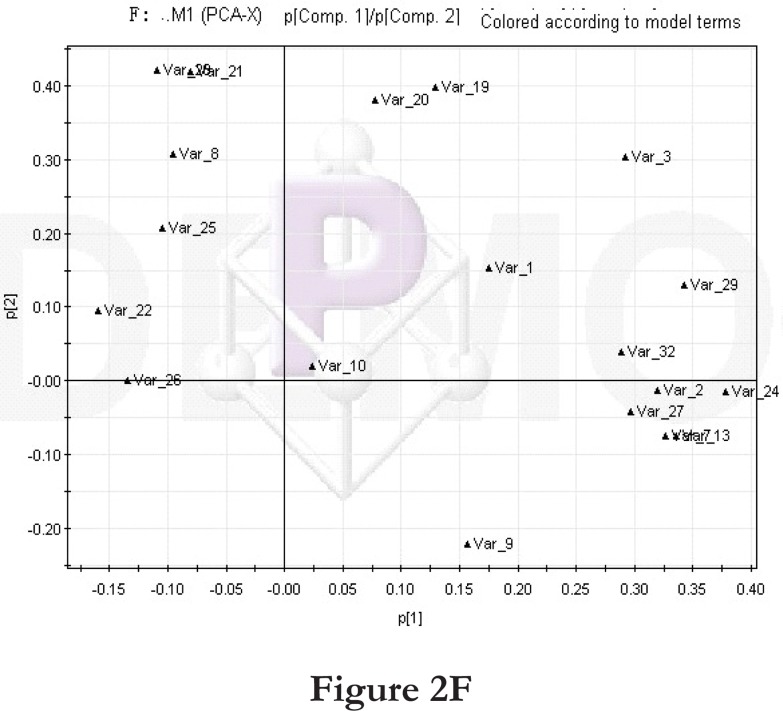
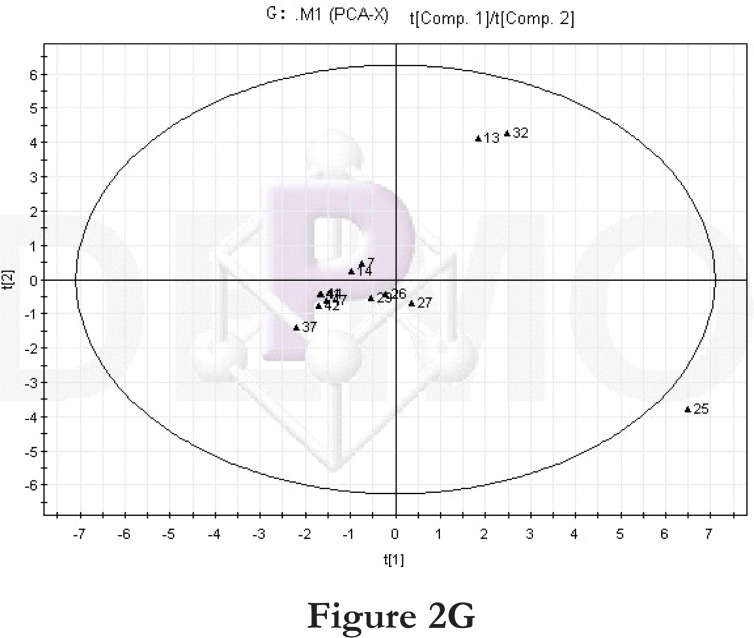
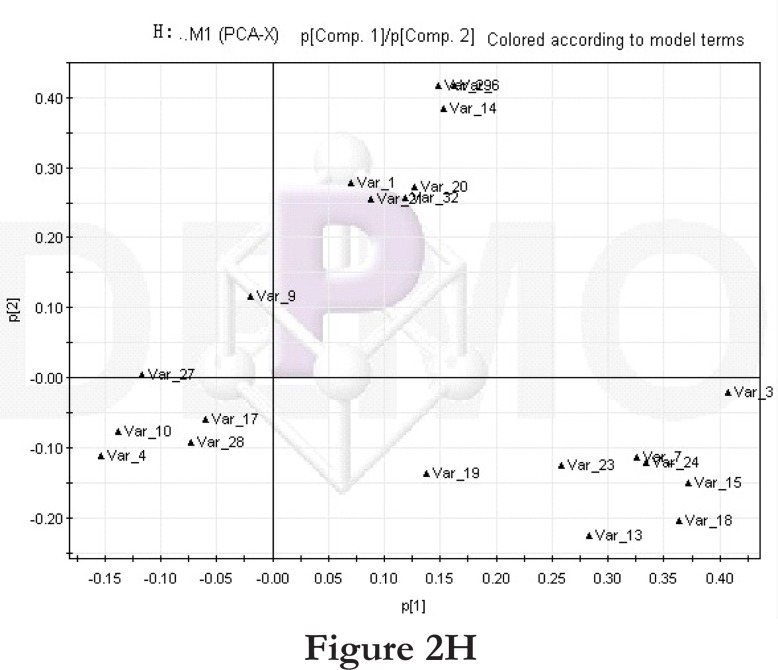
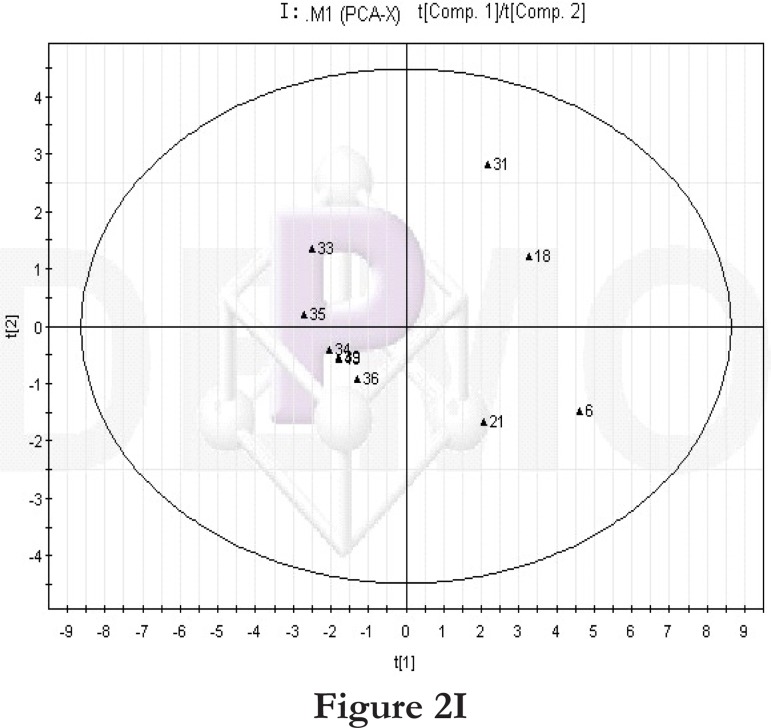
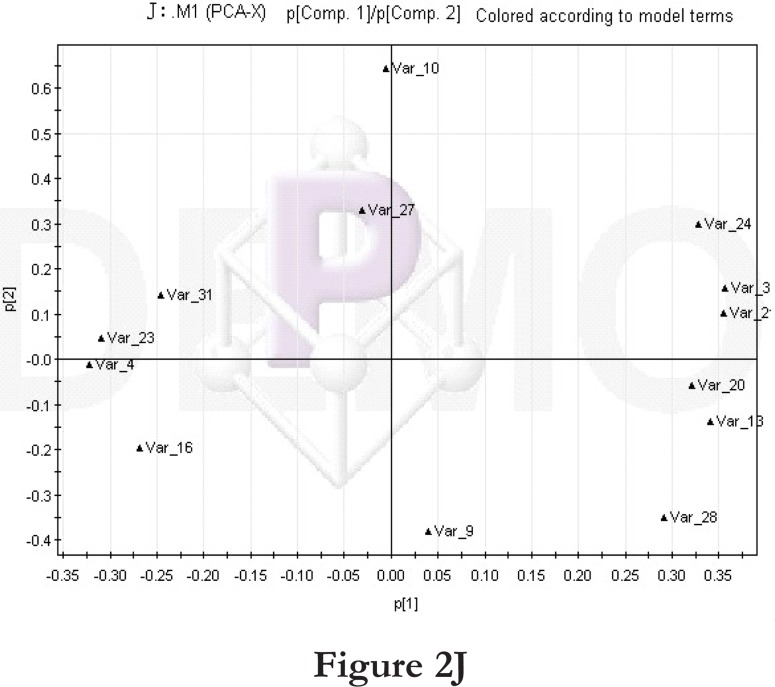
Comparisons between time points 1 and 2 of the high-fat diet group: PCA score plot (A) and loading diagram (B). Comparisons between the high-fat diet group and control group at time point 1: PCA score plot (C) and loading diagram (D). Comparisons between the high-fat diet group and control group at time point 2: PCA score plot (E) and loading diagram (F). Comparisons between time points 1 and 2 of the TCM group: PCA score plot (G) and loading diagram (H). Comparisons between time points 1 and 2 of the rosiglitazone maleate group: PCA score plot (I) and loading diagram (J).
Figure 2A.
Figure 2B.
Figure 2C.
Figure 2D.
Figure 2E.
Figure 2F.
Figure 2G.
Figure 2H.
Figure 2I.
Figure 2J.
Then we compared the high-fat diet group and control group at the same time point. At time point 1, the PCA score plot (figure 2C) and loading diagram (figure 2D) showed that the two groups (the high-fat diet group and control group at time point 1) separated from each other along the t2 axis. The first two principal components could explain 67.4% of the total variance, and the first three principal components explained 84.2% of the total variance, covering most of the metabolite information. The PCA score plot of the first two principal components demonstrated that the samples were distributed in two regions, with the control group on the top half and the high-fat diet group on the bottom half.
Treatment comparisons: drug administration
We further compared the time points 1 and 2 of the TCM group. The PCA score plot (Figure 2G) and loading diagram (figure 2H) showed that the two groups (time points 1 and 2) separated from each other along the t2 axis. The first two principal components could explain 49.0% of the total variance, and the first five principal components explained 86.9% of the total variance, covering most of the metabolite information. The PCA score plot of the first two principal components demonstrated that the samples were distributed in two regions, with time point 1 samples on the top half and time point 2 samples on the bottom half.
We then compared the time points 1 and 2 of the rosiglitazone maleate group. The PCA score plot (figure 2I) and loading diagram (figure 2J) showed that the two groups (time points 1 and 2) separated from each other along the t1 axis. The first two principal components could explain 72.5% of the total variance, and the first three principal components explained 87.2% of the total variance, covering most of the metabolite information. The PCA score plot of the first two principal components demonstrated that the samples were distributed in two regions, with time point 1 samples on the left and time point 2 samples on the right.
Metabolite comparisons
No difference in metabolites was observed at time point 1 among the four treatment groups. At time point 2, in the high-fat diet group, the levels of dihydroxybenzoic acid, L-ascorbic acid (29 min), D-gluconic acid, alanine, glutaric acid and octadecanoic acid were higher than those in the control group (P < 0.05 or P < 0.01, table 2). In the TCM group, at time point 2, the levels of L-ascorbic acid (29 min) were lower than those at time point 1 (P < 0.05, table 2). In the high-fat diet group, at time point 2, the levels of dihydroxybenzoic acid, L-ascorbic acid (29 min), D-gluconic acid, octadecane acid, and glutaric acid were higher than those at time point 1 (P < 0.05 or P < 0.01, table 2). The metabolites were initially discovered by this experiment.
Table 2.
Urine metabolite comparisons
| Treatment | Alanine | Glutaric Acid | L-ascorbic | L-ascorbic | |
| Acid (29 min) | Acid (32 min) | ||||
| Time | TCM | 0.42±0.09 | 8.97±5.45 | 4.71±5.68 | |
| point 1 | Rosiglitazone maleate | 3.38±0.15 | |||
| High-fat diet | 1.30±0.30 | 0.410.02 | |||
| Control | 2.28±1.75 | 1.821.14 | |||
| Time | TCM | 7.12±3.88 | 1.851.33‴ | 2.64±0.27 | |
| point 2 | Rosiglitazone maleate | 15.39±1.54 | 3.15±1.40‴ | ||
| High-fat diet | 3.53±0.75* | 68.6224.97**‴‴ | 14.53±1.05**‴‴ | ||
| Control | 1.56±0.48 | 13.126.10 | 3.89±1.83 | 2.97±1.78 | |
Note:
P < 0.05 vs. the control group;
P < 0.01 vs. the control group;
P < 0.05 between time points 1 and 2; and
P < 0.01 between time points 1 and 2.
Discussion
Our study compared urine metabolites 1–3 weeks or 4–6 weeks of drug administration in a rat model of diabetes. Our results demonstrated that at time point 1, in the high-fat diet group, the levels of dihydroxybenzoic acid, L-ascorbic acid (29 min), D-gluconic acid, alanine, glutaric acid, and octadecanoic acid were higher than those in the control group. In the high-fat diet group, at time point 2, the levels of dihydroxybenzoic acid, L-ascorbic acid (29 min), D-gluconic acid, octadecanoic acid, and glutaric acid were higher than those at time point 1. The increase in L-ascorbic acid levels might reflect the triggering of anti-oxidation defense in response to the increased oxidation level in the rat model of diabetes. Octadecanoic acid, a stearic acid, belongs to saturated fatty acids and was found in some vegetable oils and animal fats. An increase in the levels of saturated fatty acids may raise the blood cholesterol level, promote resistance to insulin and other hormones, and cause hyperglycemia and other metabolic disorders. As recorded in the Kyoto Encyclopedia of Genes and Genomes, abnormalities in alanine levels are common in metabolic disorders. Therefore, the increase in alanine levels observed in our study may provide an important target for future studies.
Our results also suggested that it is a good strategy to reveal how TCM works in vivo by following metabolic changes in rats Under TCM administration, at time point 2, the L-ascorbic acid levels in the rat urine (29 min) were lower than at time point 1. This decrease might be related to the fact that the TCM could reduce oxidative stress in the rat model of diabetes 13, 14. Meanwhile, in the urine of the TCM group at time point 2, a few metabolites disappeared, including alanine, palmitic acid, octadecanoic acid, and glycerol, and several metabolites emerged, such as L-ascorbic acid (32 min), which suggested that TCM might enhance the antioxidant function of the body. In addition, both stearic acid and palmitic acid levels decreased, indicating that TCM might improve lipid metabolism. TCM might reduce high blood glucose levels by improving lipid metabolism or reducing insulin resistance. The decrease in alanine levels under TCM administration suggested that TCM might affect amino acids metabolic pathways and thus improve metabolic disorders.
GC-MS was mainly used in plant metabonomics 15. In order to apply GC-MS analysis, samples need to undergo the derivatization process to increase stability and volatility. Therefore, GC-MS analysis is limited to volatile substances, and cannot be used to analyze thermal unstable substances, such as lipid membrane, or metabolites of high molecular weight. In this study, we used GCMS to analyze changes in urine metabolites in a rat model of diabetes. In future studies, other metabonomics technology can be incorporated to examine more metabolites and further explore the mechanisms underlying diabetes. Another interesting issue is to study whether similar metabolic changes also exist in other animal models of type II diabetes.
Future studies can be strengthened in two aspects. First, the sample size could be increased. Second, the condition of diabetes could be aggravated to facilitate the detection of differences in metabolites. In addition, under mild diseases, difference in metabolites could be masked when urine samples that contain the final metabolites are examined. Future research can also employ blood metabonomics to search biomarkers closely related to disorders in sugar, fat, and protein metabolism. Other technologies in system biology, including proteomics and genomics, can also be applied to study different syndromes of type II diabetes.
Conclusion
Our results showed that in the high-fat diet group, at time point 2, the urine levels of dihydroxybenzoic acid, L-ascorbic acid, D-gluconic acid, octadecanoic acid, and glutaric acid were significantly higher than at time point 1. In the TCM group, at time point 2, the urine levels of L-ascorbic acid were markedly lower than at time point 1. Our studies demonstrated that examining urine metabolic changes provided important insights into the mechanisms underlying type II diabetes as well as the therapeutic effects of TCM.
According to former research 16, taking in less sugar and lat, and adding more aerobic exercise can reduce the morbidity of type II diabetes greatly in daily life.
Table 3.
Urine metabolite comparisons
| Treatment | Glycerol | Dihydroxybenzoic | Palmitic | D-gluconic | Octadecanoic | |
| Acid | Acid | Acid | Acid | |||
| Time | TCM | 0.78±1.03 | 3.482.81 | 1.91±1.45 | 8.09±5.92 | 2.28±1.35 |
| point 1 | Rosiglitazone maleate | 3.23±0.15 | 8.52±9.48 | |||
| High-fat diet | 0.37±0.13 | 0.83±0.53 | 0.21±0.07 | |||
| Control | 0.17±0.25 | 3.33±1.12 | 2.23±0.93 | 3.73±2.27 | 2.02±1.01 | |
| Time | TCM | 2.35±1.36 | 8.30±8.21 | |||
| point 2 | Rosiglitazone maleate | 2.48±0.73 | 4.62±2.91 | |||
| High-fat diet | 7.21±1.32*%% | 56.045.03**%% | 3.32±1.07*%% | |||
| Control | 3.09±1.33 | 6.57±3.79 | 1.18±0.63 | |||
Note:
P < 0.05 vs. the control group;
P < 0.01 vs. the control group;
P < 0.05 between time points 1 and 2; and
P < 0.01 between time points 1 and 2.
Acknowledgement
The work is supported by the National Basic Research Program of China (973 Program) under grant no. 2011CB505106, National Science Foundation of China under grant no. 81102730, 81173463 and 30902020, The new century excellent talent support plan of the ministry of education under grant no. NCET-11-0607, The Beijing science & technology star2011069, The Foundation of Beijing university of Chinese medicine basic scientific research business expenses under grant no. 2011-CXTD-06, and The Beijing Common special construction projects.
All animals were maintained and treated in accordance with the Principles of Laboratory Animal Care, formulated by the National Society for Medical Research, and the guide for the Care and Use of Laboratory Animals, prepared by the National Academy of Sciences and published by the National Institutes of Health (NIH Publication No. 86-23, revised 1985). The local ethics committee of Beijing University of Chinese Medicine approved all animal experiments.
References
- 1.Yang W, Lu J, Weng J, Jia W, Ji L, Xiao J, et al. Prevalence of diabetes among men and women in China. N Engl J Med. 2010;362(12):1090–1101. doi: 10.1056/NEJMoa0908292. [DOI] [PubMed] [Google Scholar]
- 2.Jun Y, Guowang X, Qunfa H, Hartmut M, Liebichb, Katja Lutzb R-M, et al. Discrimination of Type 2 diabetic patients from healthy controls by using metabonomics method based on their serum fatty acid profiles. Journal of Chromatography B. 2004;813:53–58. doi: 10.1016/j.jchromb.2004.09.023. unther Wahlc. [DOI] [PubMed] [Google Scholar]
- 3.Yuan K, Kong H, Guan Y, Yang J, Xu G. A GC-based metabonomics investigation of type 2 diabetes by organic acids metabolic profile. J Chromatogr B Analyt Technol Biomed Life Sci. 2006;850(1–2):236–240. doi: 10.1016/j.jchromb.2006.11.035. [DOI] [PubMed] [Google Scholar]
- 4.Pellati F, Orlandini G, van Leeuwen KA, Anesin G, Bertelli D, Paolini M, et al. Gas chromatography combined with mass spectrometry, flame ionization detection and elemental analyzer/isotope ratio mass spectrometry for characterizing and detecting the authenticity of commercial essential oils of Rosa damascena Mill. Rapid Commun Mass Spectrom. 2013;27(5):591–602. doi: 10.1002/rcm.6489. [DOI] [PubMed] [Google Scholar]
- 5.Choi JN, Kim J, Ponnusamy K, Lim C, Kim JG, Muthaiya MJ, et al. Metabolic Changes of Phomopsis longicolla Fermentation and Its Effect on Antimicrobial activity against Xanthomonas oryzae. J Microbiol Biotechnol. 23(2):177–183. doi: 10.4014/jmb.1210.10020. [DOI] [PubMed] [Google Scholar]
- 6.Wang Yu Z, Wang Hai C, Li Cheng H, Sun Chao H, et al. Influences of Chinese herbal remedies combined with insulin pump on islet â-cell function and insulin resistance in patients with type 2 diabetes. Journal of Beijing University of Traditional Chinese Medicine. 2010;33(2):134–137. [Google Scholar]
- 7.Gu JY, Zhang H, Chen LR, Xu S, Yuan G, Xu XJ. Drug-target network and poly pharmacology studies of a Traditional Chinese Medicine for type II diabetes mellitus. Comput Biol Chem. 2011;35(5):293–297. doi: 10.1016/j.compbiolchem.2011.07.003. [DOI] [PubMed] [Google Scholar]
- 8.Wang Xuebing, Xin-ru An, WANG Xuebing, AN Xin-ru Development of experimental study on diabetes' treatments by Chinese herb medicine. Global Traditional Chinese Medicine. 2011;04:314–317. [Google Scholar]
- 9.Razi MT, Saadullah M, Murtaza G, Hassan W. Determination of the Anti-Diabetic Effect of Methanolic Extract of Sphaeranthus Indicus Linn on Alloxan Induced Diabetic Rabbits. Latin American Journal of Pharmacy. 2011;30(2):378–382. [Google Scholar]
- 10.Jian Weixiong, Huang Xianping, Chen Qinghua. A blood metabonomics study in a rat model of blood stasis using gas chromatography-mass spectrometry. Chinese Archives of Traditional Chinese Medicine. 2009;27(4):796–798. [Google Scholar]
- 11.Jian W, Yuan Z, Huang X, Chen Q, Zheng Jinghui, Li Y, Wang Liping. Analysis on urine metabolomics of coronary heart disease patients with the heart blood stasis syndrome. Journal of Traditional Chinese Medicine. 2010;51(8):729–732. [Google Scholar]
- 12.Sun Yongning, Feng Wen, Liu Zhong. A blood metabonomics study in a rat model of diabetes. Journal of Shandong Traditional Chinese Medicine University. 2010;34(1):80–82. [Google Scholar]
- 13.Rembacz KP, Sawicka E, Dugosz A. Role of estradiol in chromium-induced oxidative stress. Acta Pol Pharm. 2013;69(6):1372–1379. [PubMed] [Google Scholar]
- 14.Zigdon H, Kogot-Levin A, Park JW, Goldschmidt R, Kelly S, Merrill AH, Jr, Scherz A, et al. Ablation of ceramide synthase 2 causes chronic oxidative stress due to disruption of the mitochondrial respiratory chain. J Biol Chem. 2013;288(7):4947–4956. doi: 10.1074/jbc.M112.402719. [DOI] [PMC free article] [PubMed] [Google Scholar]
- 15.Zhang Junya, Yuan Jingru, Sun Yanru. systematic review of Chinese medicine on preventing and treating diabetes. Journal of Traditional Chinese Medicine. 2013;54(3):245–249. [Google Scholar]
- 16.Fiehn O, Kopka J, Dörmann P, Altmann T, Trethewey RN, Willmitzer L. Metabolite profiling for plant functional genomics. Nat Biotechnol. 2000;18:1157. doi: 10.1038/81137. [DOI] [PubMed] [Google Scholar]


