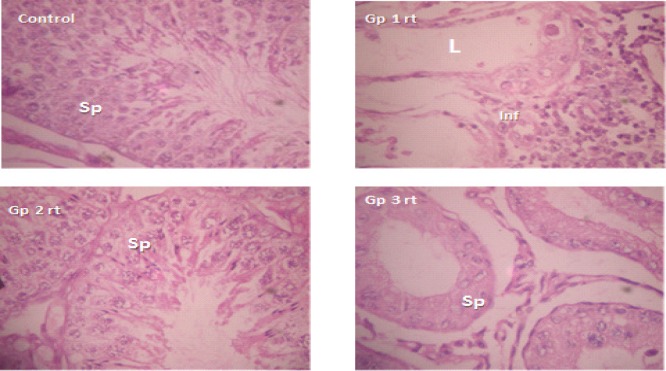
Figure 2.
Testicular sections of right testis of control, right testis of groups 1, 2 and 3; H & E × 400. Sp represent spermatogenic cells in seminiferous tubules; L is lumen of seminiferous tubules; Inf is infiltrates in the interstittium; note extensive degeneration of spermatogenic cells in groups 1 and 3 respectively

