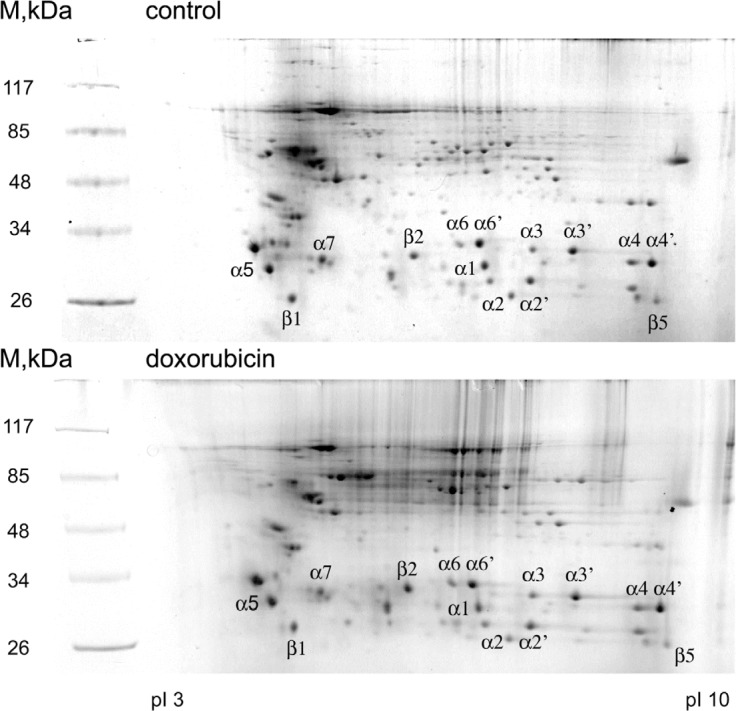
Figure 1. 2D electrophoregrams of proteasomal proteins before and after doxorubicin treatment.

Proteasomes were extracted from control (A) and doxorubicin treated (B) K562 cells and then separated on 2D-gel (isoelectric focusing followed by SDS-PAGE). Separated proteins were visualized by Coomassie staining. Marked spots were excised from the gel and analyzed by mass-spectrometry.
