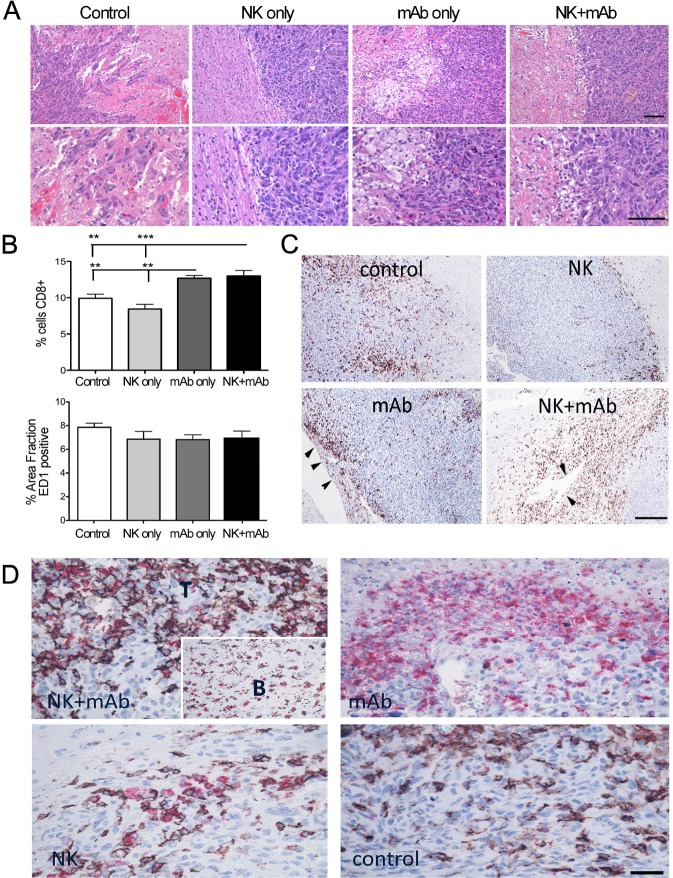
Figure 2. Differential macrophage/microglia phenotypes in response to treatment in U251-NG2 tumours.
(A) Upper panels, H&E staining showing tumor-brain boarders with varying amounts of large foamy cells (white) in response to mAb9.2.27 monotherapy and NK+mAb9.2.27 combination treatment (scale bar 200 μm, magnification 100 X). (A) Lower panels show higher magnification of the confrontation zone (scale bar 200 μm, magnification 200 X), (B) Upper panel show quantification of area fraction CD8+ cells in control, monotherapy NK cells, mAb9.2.27 as well as in NK+mAb9.2.27 combination treatment, lower panel shows quantification of area fraction ED1+ cells, in the same groups as above. Data represent mean ±SEM from all tumors in the groups. (C) Immunolabeling of CD8 shows abundant recruitment via vascular cuffs and choroids plexus in NK+mAb9.2.27 and mAb9.2.27 treatments, (arrowheads) respectively. Control and NK treated tumors show CD8+ cells that are restricted to tumor/brain periphery scale bar 200 μm, magnification 200X. (D) Double labeling for CD8 (brown) and ED1 (red) show abundant double positive macrophage/microglia in the tumor core (T) as well as those migrating from the brain (B, insert). mAb9.2.27 treated tumors show predominantly ED1 single positive, controls show CD8 single positive, and NK monotherapy shows fewer CD8/ED1 double positive cells that remain at the tumor/brain periphery (scale bar 100 μm, magnification 400 X).

