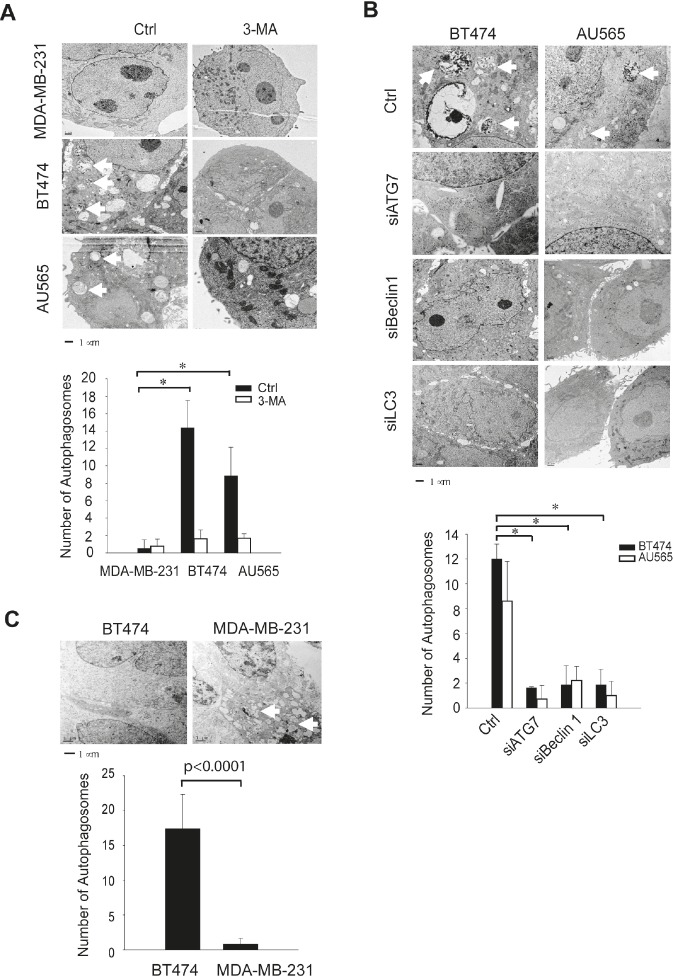
Figure 3. TEM images reveals autophagosome structures in TRAIL-resistant cell lines and xenograft tumor models.
(A) Electron microscopy (EM) images show the ultrastructural features of untreated cells or cells treated with 3-methyladenine (3-MA) at 10 mM for 24 h (Bar =1 μm). Arrows denote the autophagosome ultrastructures in cytoplasm. Lower panel shows the average number of autophagosome structures per view (371 μm2) obtained by examining at least 50 images per testing sample. *p<0.0001. (B) EM images of parental cells and cells transfected with siRNA specific to the autophagy regulatory genes ATG7, Beclin 1, and LC3, respectively. Images are representatives of at least 50 captures. Lower panel shows the average number of autophagosome structures as determined in (B) for individual samples. *p<0.0001. (C) Nude mice were injected s.c. with BT474 or MDA-MB-231 cells per the protocol described in the Materials and Methods. When tumors reached 0.6 cm3 in size, tumor tissues were harvested and analyzed by EM imaging. Bar =1 μm. Lower panel shows the quantification of autophagosome numbers in the respective tissues.

