
Figure 5.
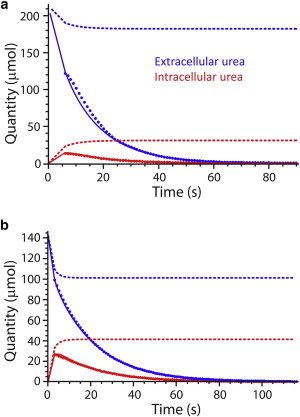
Addition of 2 mL of hyperpolarized urea to 2 mL of RBCs at (a) 20°C; and (b) 37°C. Data points were obtained from the deconvolution of the experimental NMR spectra. (Solid and dashed lines) Evolution of the hyperpolarized and total species (both hyperpolarized and nonhyperpolarized) obtained after the MCMC fitting, using the fast-isomerization carrier model. To see this figure in color, go online.