
Figure 3.
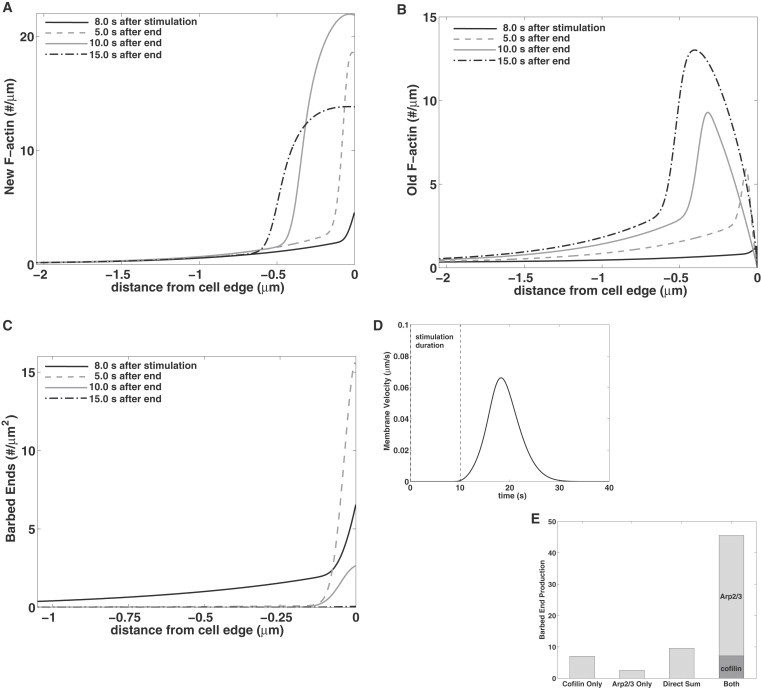
The spatial model with simultaneous activation of cofilin and Arp2/3 for 10 s (JC = 1.6 μM × μm/s, Aedge = 44 μM for 0.1 ≤ t ≤ 10.1 s; see boundary conditions in Eq. 12). (A–C) Profiles of new F-actin, and old F-actin, and barbed ends during stimulation (at 8 s) and at 5, 10, and 15 s after the end of stimulus. (D) The protrusion rate Vmb as a function of time. (E) Total barbed-end production obtained using cofilin alone; Arp2/3 alone; the expected barbed ends without synergy (direct sum); and in the presence of both. The barbed ends produced by cofilin (∫∫Fsevdx dt) and by Arp2/3 (∫∫Fnucdx dt) are shown.