
Figure 6.
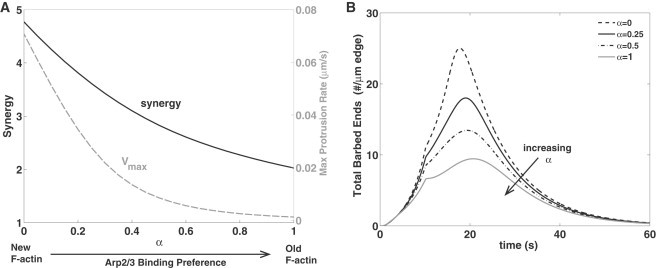
Effect of Arp2/3 binding preference to new ATP-F-actin versus old ADP-F-actin, depicted by α in Eq. 16. (A) Maximum protrusion rate Vmax (in gray dashed line) and synergy (in solid line) versus α. As in Fig. 3, JC = 1.6 μM × μm/s and Aedge = 44 μM, simultaneous cofilin and Arp2/3 activation for 10 s, but with Arp2/3 barbed-end production rate defined in Eq. 16. (B) Time course of total number of barbed ends (∫B(x,t)dx + Bp(t)) for α = 0, 0.25, 0.5, and 1.