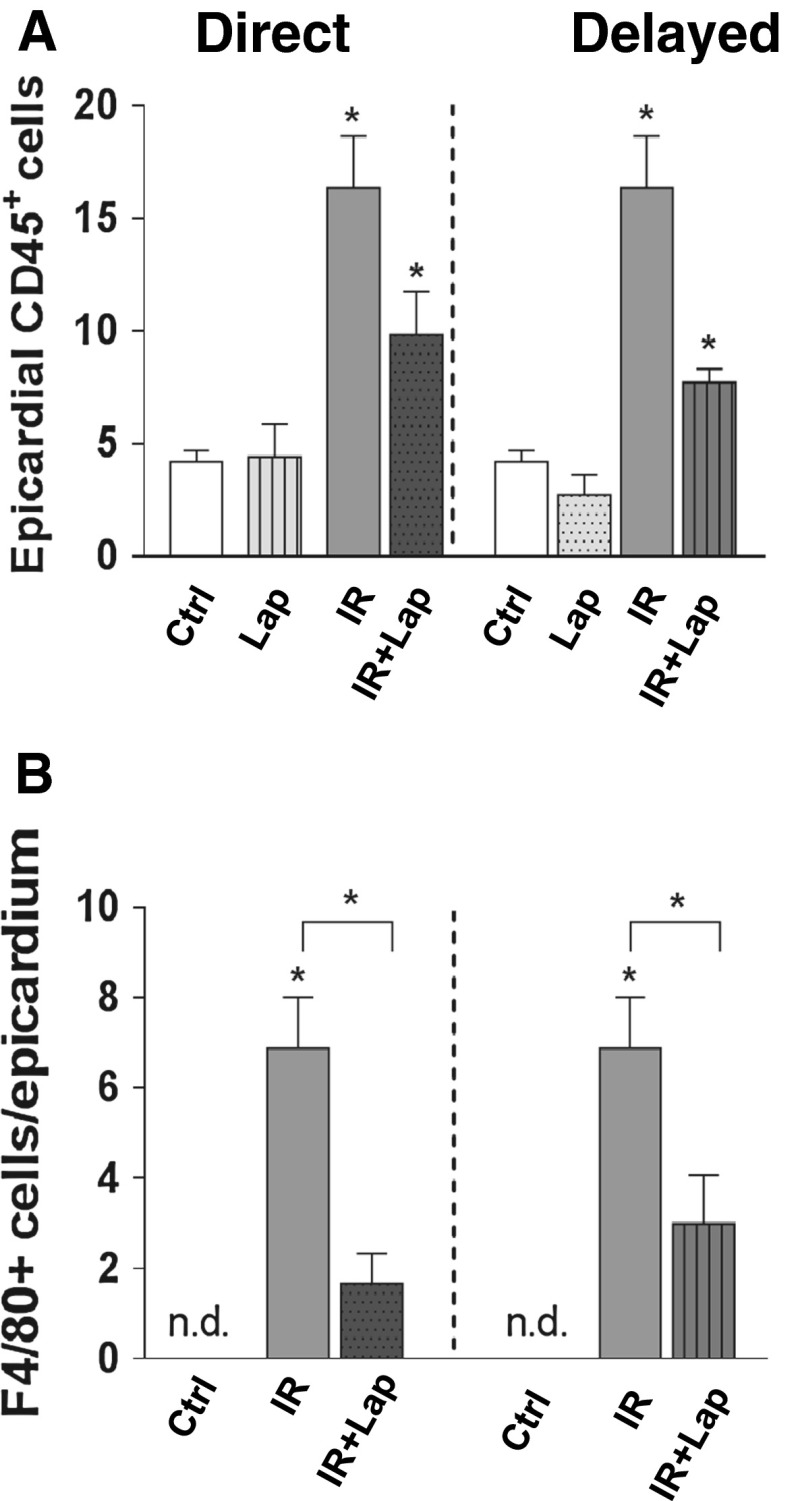
Fig. 5.
Inflammatory changes after ErbB2 inhibition alone or in combination with irradiation. a Quantification of CD45+cells b and of F4/80+cells per section in the epicardium. Each value represents the mean (±SEM) for minimal five mice per group. *p < 0.05 compared to age-matched untreated controls. n.d. not determined. Ctrl control; Lap lapatinib; IR irradiation; IR+lap irradiation combined with lapatinib

