
Fig. 1.
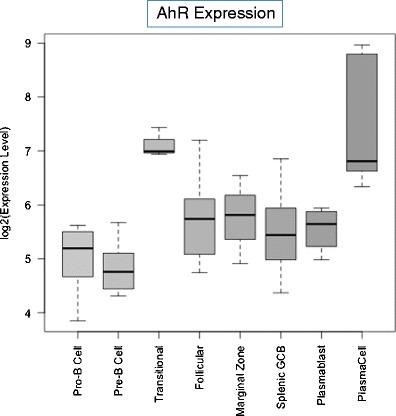
Relative AhR mRNA expression in purified subpopulations of murine B cells. Microarray data were generated by Green et al. [1] from murine B cells sorted by flow cytometry based on B developmental stage-specific surface antigens. Expression levels of the AhR transcript within the listed differentiation stages was extracted from [1] and the corresponding distributions summarized and displayed as 'box-and-whiskers' plots (with the bottom and the top of the box corresponding to the first and third quartiles, the thick band inside the box indicating the median, and the end of the 'whiskers' extending to 1.5 times the interquartile range in both directions)