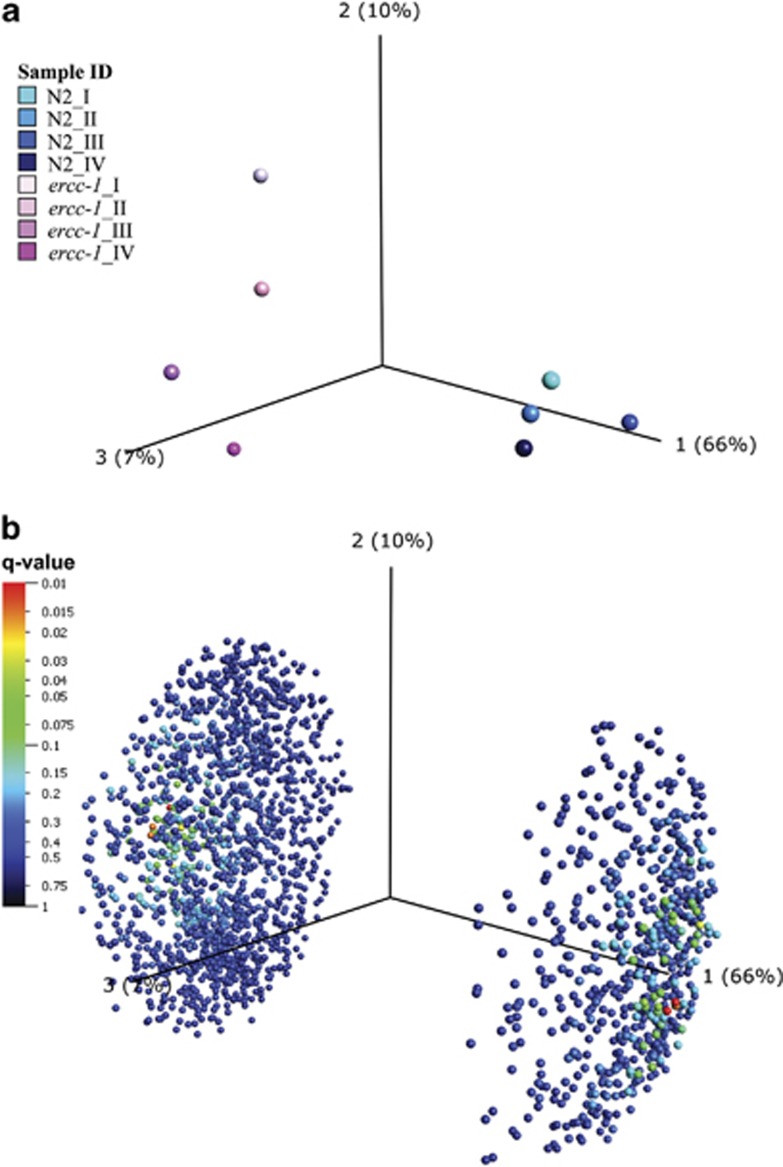
Figure 2.
Factorial map of PCA. PCA on either sample (a) or variables/transcripts (b) between ercc-1 and the wild type (N2) was conducted using the 2139 statistically significant (P<0.05) transcripts found in the ercc-1 mutant group compared with its wild-type counterpart. (a) PCA on the replica samples for ercc-1 and the wild type. The eight samples group together strain-wise. All samples are colored individually (ercc-1 and wild type are colored with different shades of pink and blue, respectively). The PCA indicates that the ercc-1 group has more biological variance than the wild-type control group. (b) PCA on the 2139 statistically significant transcripts between ercc-1 and wild type. The 2139 variables/genes are divided by their variation, found in the data set (Component 1, 2 and 3). The component can thus be interpreted as the variation found within and between the sample groups. For both the samples and the transcript PCA plots, the largest explainable variance is found in component 1, where 66% of the data variation can be explained. This 66% is the difference found between ercc-1 and wild type and thus divides the variables in ercc-1 and wild-type sample groups. Components 2 and 3, with 10 and 7%, respectively, explain the biological variance within each sample group. Here, the variance within the ercc-1 sample group is larger than in the wild-type control sample group, that is, more spread in the direction of components 2 and 3 compared with the wild-type samples. Most variables were found to have the trend upregulated in the ercc-1 group (1530 upregulated, compared with 609 downregulated). For the variable PCA, the transcripts are color-coded based on their Q-value (false discovery rate), where red (Q<0.01) is the lowest Q-value found for a handful of genes. See also Supplementary Tables S1, S3 and Supplementary Figure S1

