Figure 4.
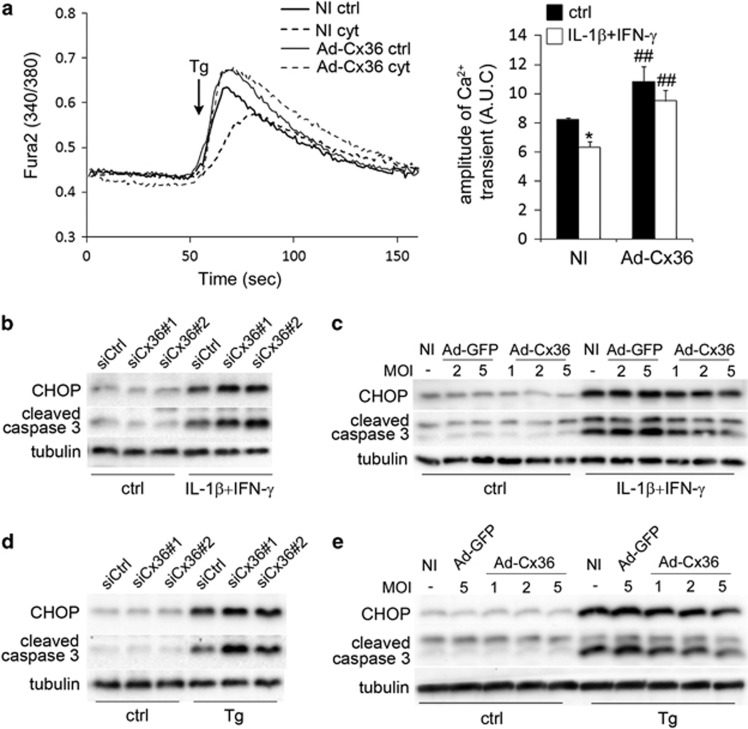
Changes in Cx36 expression modulate ER stress, CHOP and activate caspase 3 levels in INS-1E cells. (a) INS-1E cells were infected or not (NI) with a control adenovirus (Ad-GFP) or a rat Cx36 adenovirus (Ad-Cx36) at various multiplicity of infection (MOI), as indicated. Cells were then treated or not (ctrl) for 15 h with IL-1β+IFN-γ (cyt), loaded with the cytosolic calcium-dye Fura-2 and monitored in Ca2+-free KRBH in presence of the SERCA inhibitor thapsigargin (Tg; 5 μM, arrow). Left panel: data are representative traces. Right panel: quantitative assessment of the cytosolic Ca2+ rise calculated by the area under the curve (A.U.C.) of four independent experiments. *P<0.05 versus ctrl condition; ##P<versus respective NI condition. (b–d) Representative western blot for CHOP and cleaved caspase 3 over tubulin levels in INS-1E cells transfected with a control siRNA (siCtrl) or two different Cx36 siRNA (siCx36#1 and #2) and treated for 24 h with IL-1β+IFN-γ (b) or for 15 h with thapsigargin (Tg: 100 nM; (d)). (c–e) Representative western blot for CHOP and cleaved caspase 3 over tubulin levels in INS-1E cells infected or not (NI) with a control adenovirus (Ad-GFP) or a rat Cx36 adenovirus (Ad-Cx36) at various MOI and treated for 24 h with IL-1β+IFN-γ (c) or for 15 h with thapsigargin (Tg: 100 nM; (e))

