Figure 2.
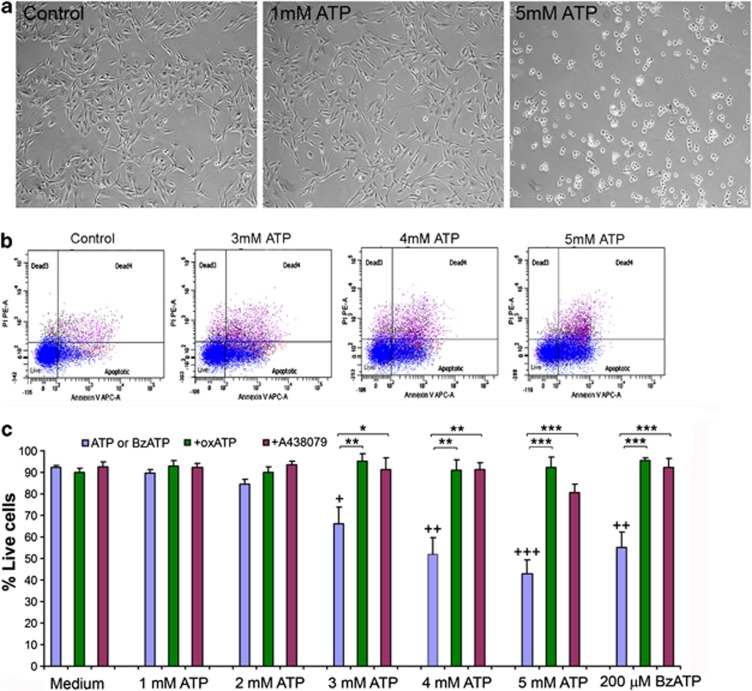
ATP induces SC death dose-dependently in vitro. (a) Phase contrast images showing SCs in culture with or without exposure to ATP for 30 min. (b) Flow cytometry cell viability assay showing the proportions of live cells after exposure to 3, 4, 5 mM ATP for 1 h. (c) The percentage of live SCs after being exposed to increasing concentrations of ATP or BzATP (200 μM) with or without oxATP (350 μM) or A438079 (100 μM).+P<0.05, ++P<0.01, +++P<0.001 (compared with the group without ATP); *P<0.05, **P<0.01, ***P<0.001 (compared between the corresponding groups with or without one of the antagonists), single factor AVNOA, n=3–7

