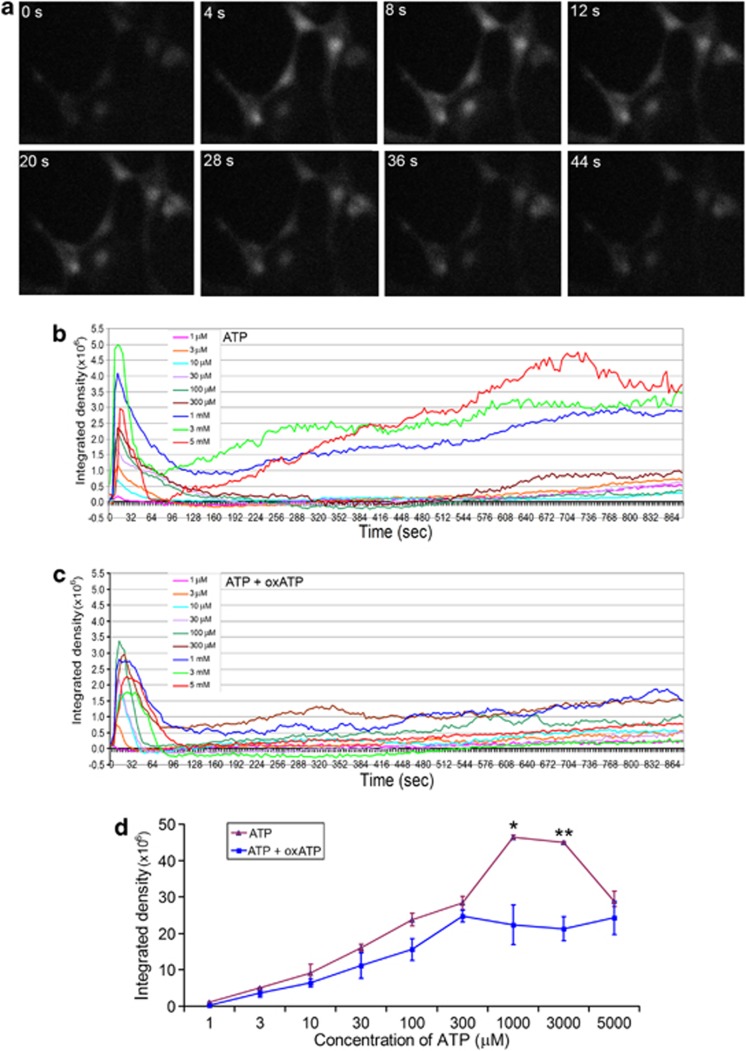
Figure 4.
ATP increases [Ca2+]i level in SCs. (a) Sequential images of Fluo-4 fluorescence captured by a time-lapse microscope over a period of 44 s in SCs pretreated with 350 μM oxATP and then exposed to 30 μM ATP. (b) Representative time course of [Ca2+]i levels indicated by Fluo-4 fluorescence intensities in SCs after exposure to different concentrations of ATP. (c) Representative time course of [Ca2+]i levels in SCs pretreated with oxATP (350 μM) and then exposed to different concentrations of ATP. (d) Quantification of Fluo-4 fluorescence intensities in SCs in the first 100 s (peak phase) after exposure to different concentrations of ATP with or without oxATP treatment. *P<0.05, **P<0.01 (compared between groups exposed to the same concentration of ATP with and without oxATP), single factor ANOVA, n=3

