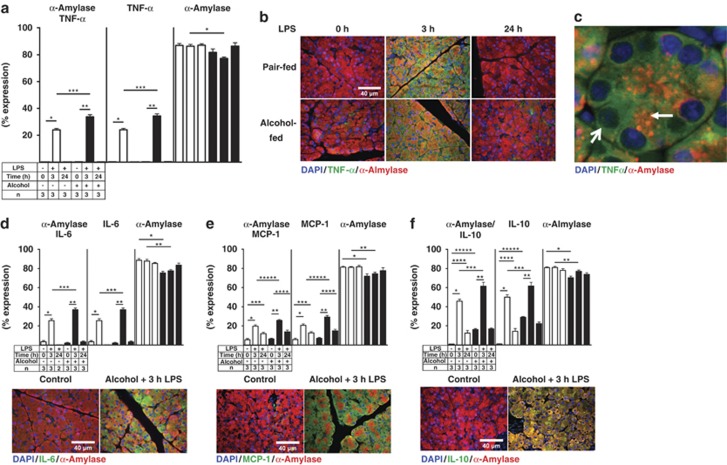
Figure 1.
Alcohol and LPS treatment increased the expression of pro-, and anti-inflammatory mediator. (a) Ten randomly captured images of TNFα and α-amylase were analyzed and scattergram values were plotted as means±S.E.M. for three animals per group. *P≤0.0001+170-fold; **P≤0.0001+165-fold; ***P≤0.0001+1.4-fold. TNFα alone: *P≤0.0001+109-fold; **P≤0.0001+170-fold; ***P≤0.0001+1.4-fold; α-amylase alone: *P≤0.0001−1.15-fold. (b) Representative images of TNFα (Cy2 green) and α-amylase (Cy3 red). (c) Higher magnification of TNFα (Cy2, green) and α-amylase (Cy3, red) acinar cell localization from alcohol-fed rats 24 h after LPS. α-amylase is mainly expressed in the apical region of the acinar cell (arrow), whereas TNFα is mainly expressed in the basolateral region of the acinar cells (open arrow). (d) Quantitation of IL-6 (Cy2, green) and α-amylase (Cy3, red). *P≤0.0001, +7.42-fold; **P≤0.001, +18-fold; ***P≤0.001, +1.44-fold. IL-6 alone: *P≤0.0001, +7.4-fold; **P≤0.001, +18-fold; ***P≤0.001, +1.42-fold. α-amylase alone: *P≤0.001, −1.17-fold; **P≤0.001, −1.13-fold. (e) Quantitation of MCP-1 (Cy2, green) and α-amylase (Cy3, red): *P≤0.0001, +3.6-fold; **P≤0.0001, both, +4-fold; ***P≤0.003, +2.2-fold; ****P≤0.016, +2.2-fold; *****P≤0.0018, +1.3-fold: MCP-1 alone: *P≤0.0001, +3.6-fold; **P≤0.0001, +4-fold; ***P≤0.027, +2.1-fold; ****P≤0.001, +2.2-fold; *****P≤0.0014, +1.41-fold: α-amylase alone: *P≤0.0001, −1.14-fold; **P≤0.0011, −1.09-fold. (f) Quantitation of IL-10 (Cy2, green) and α-amylase (Cy3, red): *P≤0.0001, +56-fold; **P≤0.0001, +3.8-fold; ***P≤0.0036, +1.3-fold; ****P≤0.0006, +14-fold; *****P≤0.0001, +20-fold. IL-10 alone: *P≤0.0001, +55-fold; **P≤0.0001, +2.1-fold; ***P≤0.0189, +1.22-fold; ****P≤0.0033, +15-fold; *****P≤0.0001, +31-fold. α-amylase alone: *P≤0.0001, −1.14-fold; **P≤0.0001, −1.05-fold

