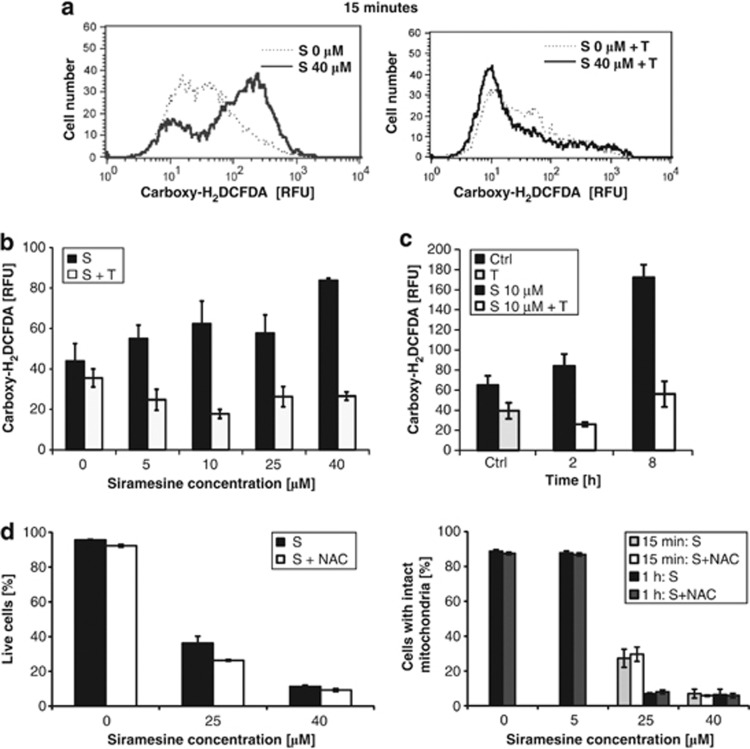
Figure 4.
ROS generation in siramesine-induced cell death. HaCaT cells were treated with different siramesine concentrations. Antioxidants α-tocopherol (0.3 mM) and NAC (8 mM) were applied 2 h before siramesine treatment. After siramesine treatment, carboxy-H2DCFDA was added to all samples at once and analysed with a flow cytometer. The geometric mean of carboxy-H2DCFDA fluorescence intensity for each sample is displayed. The experiments were performed in duplicate; the bars represent mean±S.D. (a) A histogram after 15 min incubation with 40 μM siramesine in the presence or absence of α-tocopherol. Solid lines represent siramesine-treated cells; dashed lines represent control cells. (b) ROS generation 15 min after the treatment with different siramesine concentrations. (c) ROS generation 2 h and 8 h after treatment with a low concentration of siramesine (10 μM). (d) The effect of NAC on viability and MMP. S, siramesine; T, α-tocopherol

