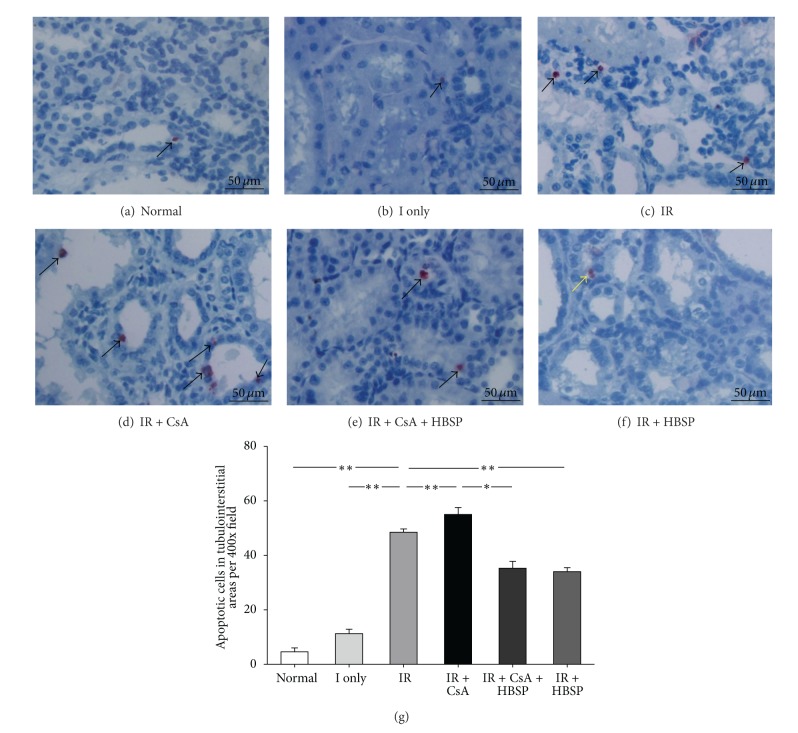
Figure 4.
Apoptotic cells, labeled by fragmented DNAs, were mainly shown in tubular areas (a, d) and interstitial areas (b, c); some in tubular lumens (e); others with polymorphous nuclei ((f), yellow arrow). The number of apoptotic cells was significantly increased in the IR and IR + CsA kidneys but decreased by HBSP (g). Data are expressed as mean number per high power field of each group (mean ± SEM; n = 6). *P < 0.05; **P < 0.01.

