Figure 8.

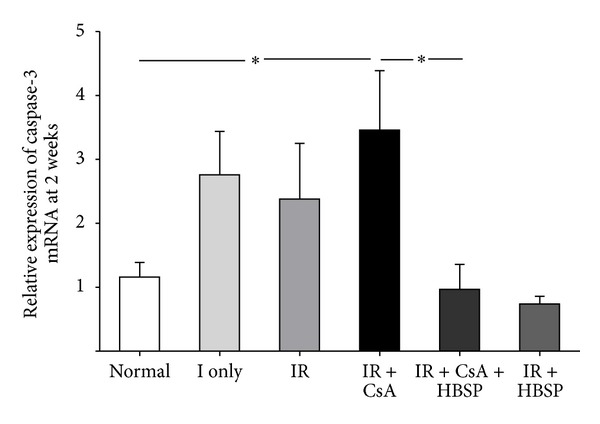
The level of caspase-3 mRNA in the kidneys, measured by qPCR, was predominantly increased by IR + CsA compared with the normal group but significantly decreased by the treatment of HBSP. Data are expressed as mean ± SEM, n = 6. *P < 0.05.

The level of caspase-3 mRNA in the kidneys, measured by qPCR, was predominantly increased by IR + CsA compared with the normal group but significantly decreased by the treatment of HBSP. Data are expressed as mean ± SEM, n = 6. *P < 0.05.