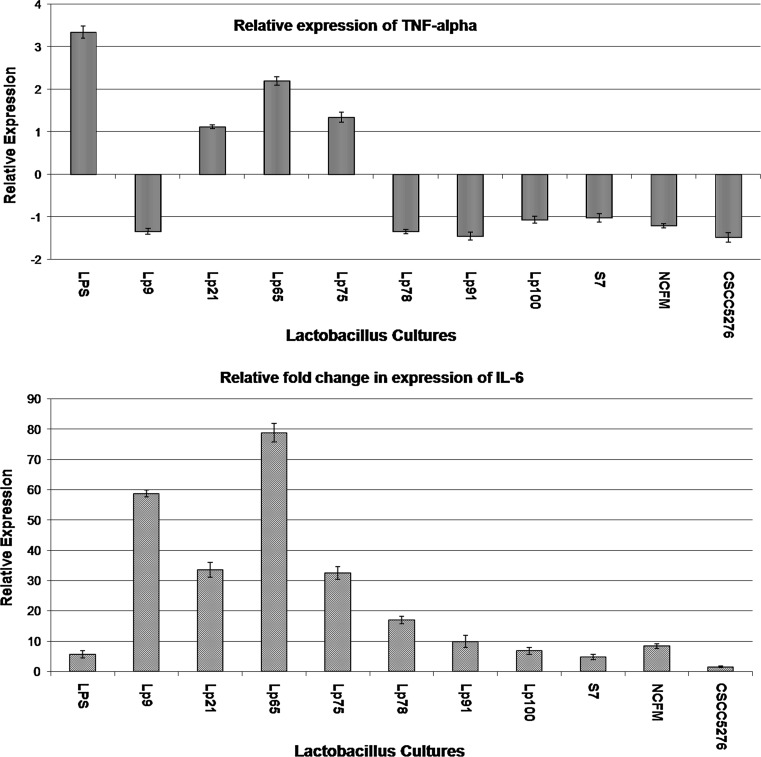
Fig. 1.
Relative expression of TNF-α and IL-6 in THP-1 cells. UP up-regulated, P (HI) probability of alternate hypothesis that difference between sample and control groups is due only to chance, NSD no significant difference from control (gene expression measurement with regard to each RNA extractions from THP-1 cells was obtained in triplicate, and the mean of these values was used for further analysis)

