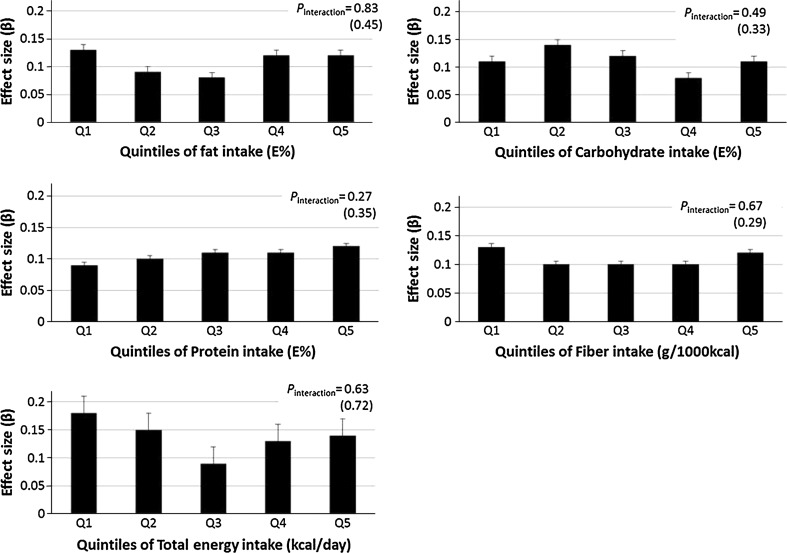
Fig. 1.
Associated effect sizes of the genetic risk score (GRS) on BMI according to intake quintiles of fat (E%), carbohydrate (E%), protein (E%), fiber (g/1,000 kcal) and total energy intake (kcal/day). Error bars represent standard error (SE). P values for interaction (P interaction) were adjusted for age, sex, season, diet assessment method version and total energy intake. The P interaction values in parenthesis refer to sensitivity analyses after excluding misreporters

