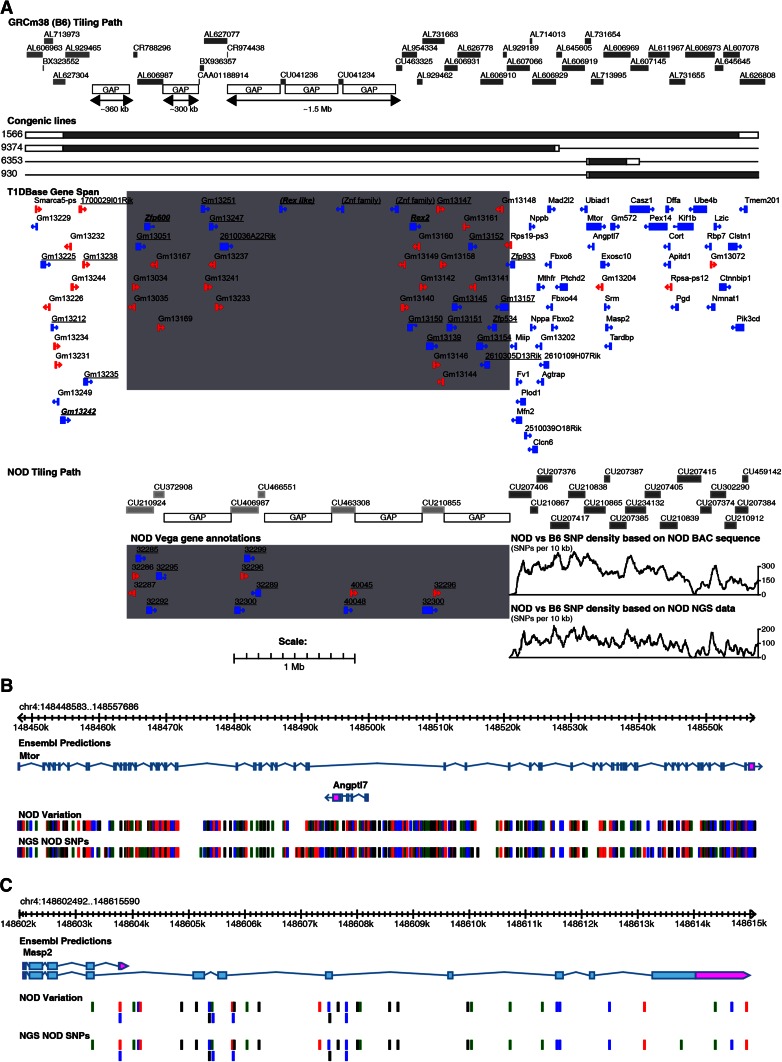
Fig. 3.
Map of the congenic strains, gene content, and SNP density of the Idd9.2 region based on GRCm38 genome build. a The NOD.B10 congenic regions within strains 1566, 9374, 6353, and 930 are shown; the grey bars indicate B10-derived DNA and the white bars indicate the regions between the “in” and “out” markers. The gene content is displayed in the T1Dbase Gene Span tract (based on GRCm38 genome build), with known genes shown in blue and pseudogenes in red. Zinc finger family members are underlined and those with high homology to Rex2 are also bold and italicized. The grey box contains the region with low sequence homology between the NOD and B6 sequence. The NOD tile path track represents the sequenced NOD BAC clones, the light grey clones are in the region with low sequence homology to B6, and their exact position is difficult to determine. The NOD Vega gene annotations are shown for these clones with their Vega database gene identifier, which has the prefix OTTMUSG000000. The SNP density tracks are shown for the region containing high sequence homology for BAC sequence and NGS data; display is SNPs per 10 kb. b Detailed SNP track covering the Mtor gene region. c Detailed SNP track covering the Masp2 gene region. The B6/NOD SNPs tracks represent the location of the polymorphic NOD/B6 SNPs; black, red, blue, and green lines represent G, T, C, and A NOD alleles, respectively. Note that where multiple SNPs are located close together the lines in the B6/NOD SNPs track may represent more than one SNP

