
Fig. 2.
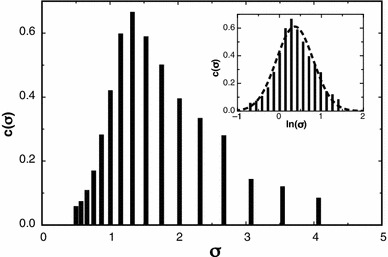
The figure profile obtained by MultiSig analysis of data from an SE run on a sample of pullulan. The inset profile shows the data plotted on a logarithmic scale, showing a normal Gaussian distribution
Official websites use .gov
A
.gov website belongs to an official
government organization in the United States.
Secure .gov websites use HTTPS
A lock (
) or https:// means you've safely
connected to the .gov website. Share sensitive
information only on official, secure websites.
The figure profile obtained by MultiSig analysis of data from an SE run on a sample of pullulan. The inset profile shows the data plotted on a logarithmic scale, showing a normal Gaussian distribution