
Fig. 5.
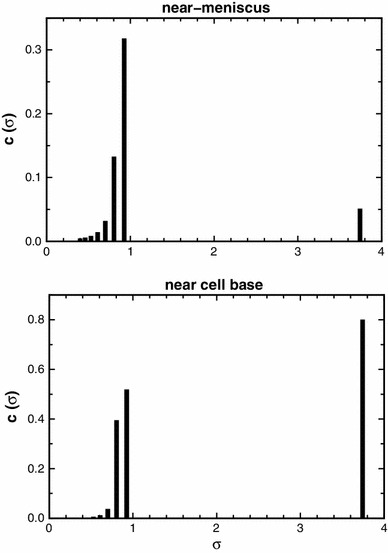
c(σ) vs. σ profile computed by MulitSig analysis for the aminopolysaccharide M902TODA for cell radial positions near to the meniscus (upper plot) and near to the cell base (lower plot)
Official websites use .gov
A
.gov website belongs to an official
government organization in the United States.
Secure .gov websites use HTTPS
A lock (
) or https:// means you've safely
connected to the .gov website. Share sensitive
information only on official, secure websites.
c(σ) vs. σ profile computed by MulitSig analysis for the aminopolysaccharide M902TODA for cell radial positions near to the meniscus (upper plot) and near to the cell base (lower plot)