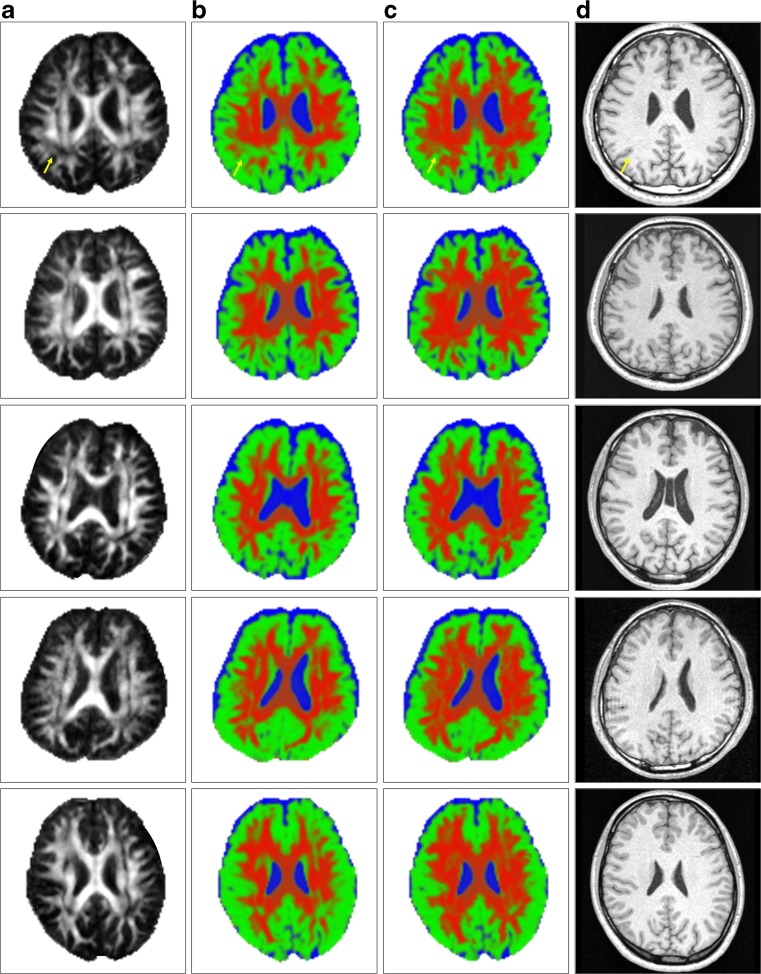
Fig. 4.
Images in five healthy volunteers at the level of corona radiata, which include many voxels with more than one fiber orientation. a The FA maps, b the estimated partial volume fraction maps obtained by the conventional method, c the estimated partial volume fraction maps obtained by proposed method, and the structural images (T 1-weighted images). Yellow arrows point to the parietal deep WM area. Note that in panels b and c, the partial volume fractions of WM, GM, and CSF in the voxel, which ranged from 0 to 1, are respectively assigned to red, green, and blue components in the color image, which ranged from 0 to 255

