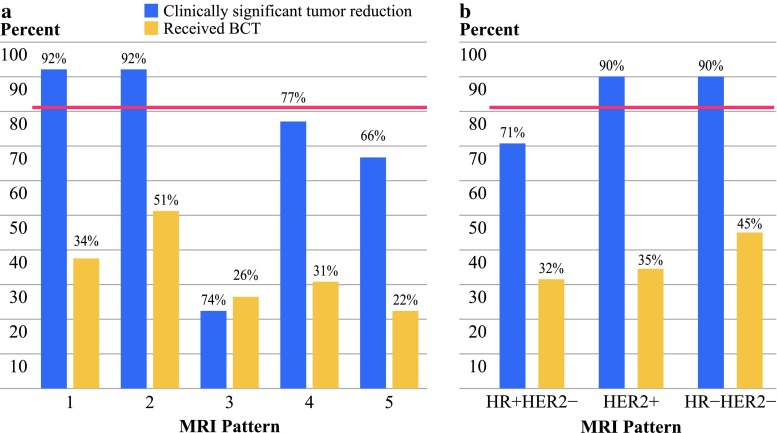
Fig. 2.
a Bar plot showing percentage of patients who had clinically meaningful tumor reduction (blue) and who received BCT (yellow) after NAC by MRI phenotype; pink line represents the average rate of clinically meaningful tumor reduction (81 %). Subjects with well-defined MRI phenotypes (1 and 2) were more likely to have a clinically meaningful tumor reduction and receive BCT after NAC. b Bar plot showing same data by receptor subtype. Her2+ and Tneg tumors had a higher likelihood of having clinically meaningful tumor reduction after NAC compared to HR+/Her2− tumors; however, the actual rates of receiving BCT do not differ by subtype

