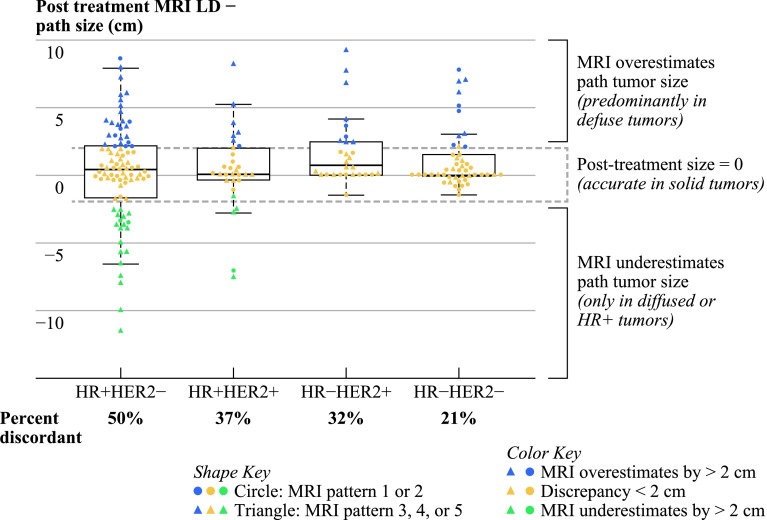
Fig. 4.
Vertical axis shows the difference in centimeters between post-NAC MRI longest diameter and tumor size on surgical pathology. Solid tumors had smaller size discrepancies than diffuse tumors. MRI underestimated path tumor size only in diffuse or HR+ tumors. For cases where MRI was accurate (<2 cm difference), there were 72 solid and 51 diffuse cases. For cases were MRI overestimated path tumor size, there were 16 solid and 36 diffuse cases. MRI most often overestimated the size of diffuse tumors, except in the case of HR+/Her2− tumors. Circles represent MRI phenotypes 1 and 2; Triangles are phenotypes 3, 4, and 5

