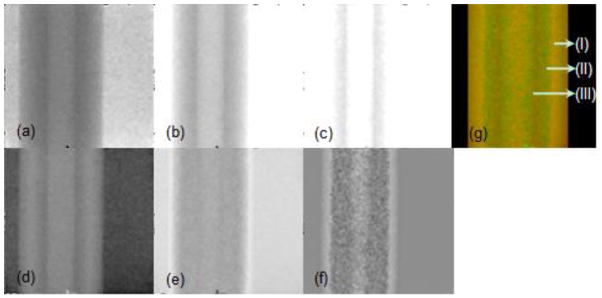
Fig. 5.

Projection evaluation result of the rubber tube saturated by iodine solution. Images (a)–(c) are projections from thresholds of 8, 28 and 38 keV, respectively. Images (d)–(f) are the eigen-images extracted from 16 projections with respect to the first three maximum eigenvalues. Image (g) is the final mapping from the eigen-images (d)–(f), where (I) is the part unsaturated by iodine, (II) is the part saturated by iodine, and (III) is the solid iodine adhering to interior surface of the rubber tube.
