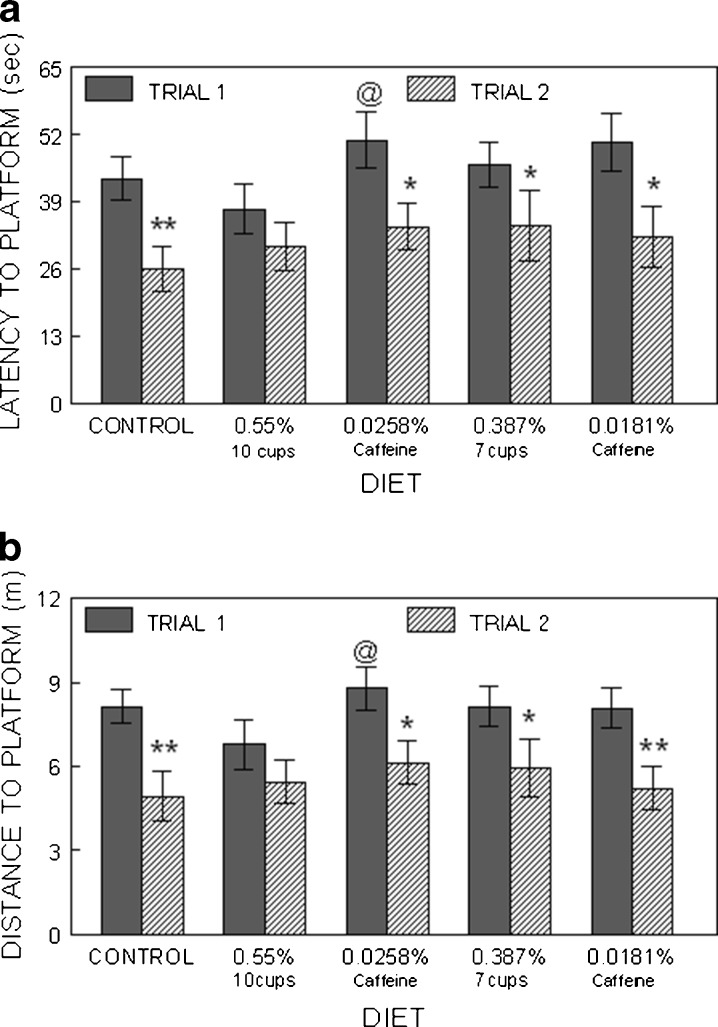
Fig. 4.
Morris water maze performance assessed as latency in seconds (a; mean ± SEM) and distance in meters (b) to find the hidden platform on days 3 and 4 of testing animals in the control, coffee, and caffeine groups. The asterisks indicate a difference (i.e., an improvement) between Trial 1 and Trial 2 performances (one asterisk indicates p < 0.05, two asterisks p < 0.01), indicating improved working memory. Commercial at indicates p < 0.05 compared to the ten-cup group

