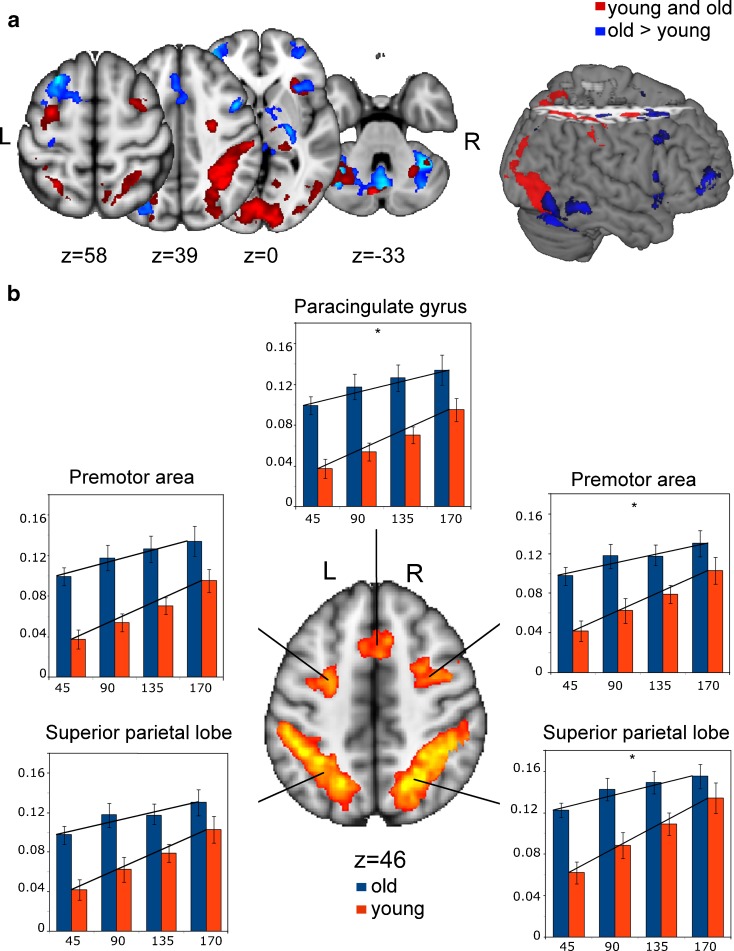
Fig. 4.
Activation maps representing a regions that were active in both groups for the contrast ‘mental rotation task > control task’ (red) and regions that were overactivated by the old group (blue) and b regions of linear parametric modulation (p < 0.01, cluster-corrected for multiple comparisons). Bar plots show means ± standard errors of the % signal change (y-abcis), according to the four rotation angles (x-abcis). * Significantly (p < 0.05, Bonferroni-corrected for the five clusters) smaller slope in the old as compared to the young group. A color reproduction of the figure can be found online on www.springer.com

