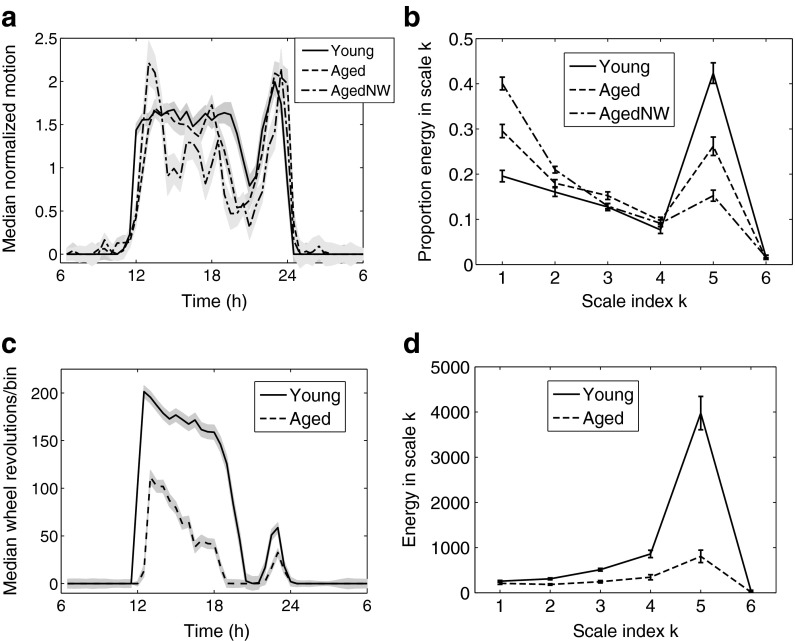
Fig. 2.
Analysis of activity under control conditions: a median normalized motion under LD12:12. Gray band indicates the standard error of the median. b Proportion of energy in discrete wavelet transform (DWT) scales of motion, which can be interpreted as proportion of variance accounted for by each period range. All three groups are signficantly different in proportion of energy in level k = 1 and in circadian level k = 5 (p < 0.001) but not significantly different for levels k = 2, 3, and 4 (multiple comparison test). c Median wheel revolutions per 30-min bin. d Energy in DWT scales for wheel-running activity. Young mice had greater magnitude of overall activity and much greater energy in the circadian scale k = 5. In b and d, error bars show mean ± SEM. NW signifies animals housed without access to a running wheel

