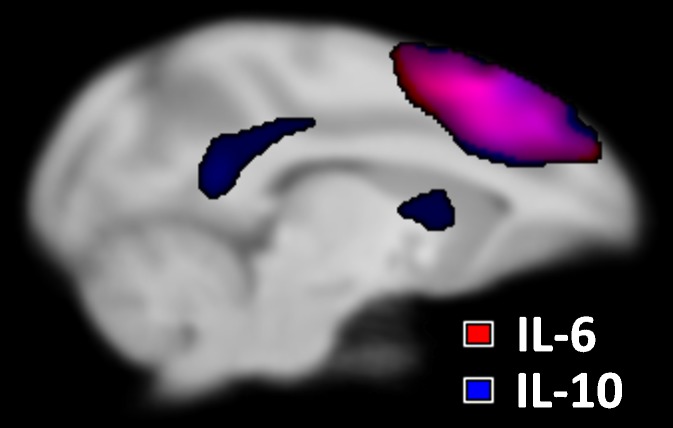
Fig. 4.
The overlap between the Dietary Condition by IL-10 interaction map (in blue) and a Dietary Condition by IL-6 map (in red) produced in prior work (Willette et al. 2010). The purple color represents the spatial area where the two statistical effects overlap. The sagittal cross-section depicts the left hemisphere

