Fig. 1.
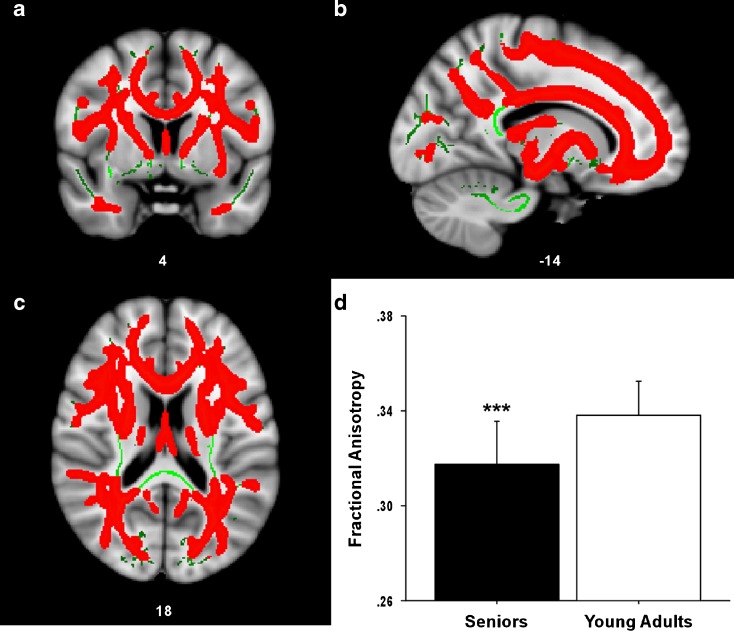
Age-related reductions in FA. Statistical map showing WM regions (a coronal, b sagittal, c transverse sections) where FA was significantly greater (red) in younger adults compared to seniors. The anatomic underlay used for illustration is the MNI152 T1-weighted 1-mm brain. The registered average FA skeleton is represented in green. d The average FA value across the entire WM skeleton is presented in the inset graph for both seniors and young adults. The average age-related reduction in FA was significant across the entire WM skeleton

