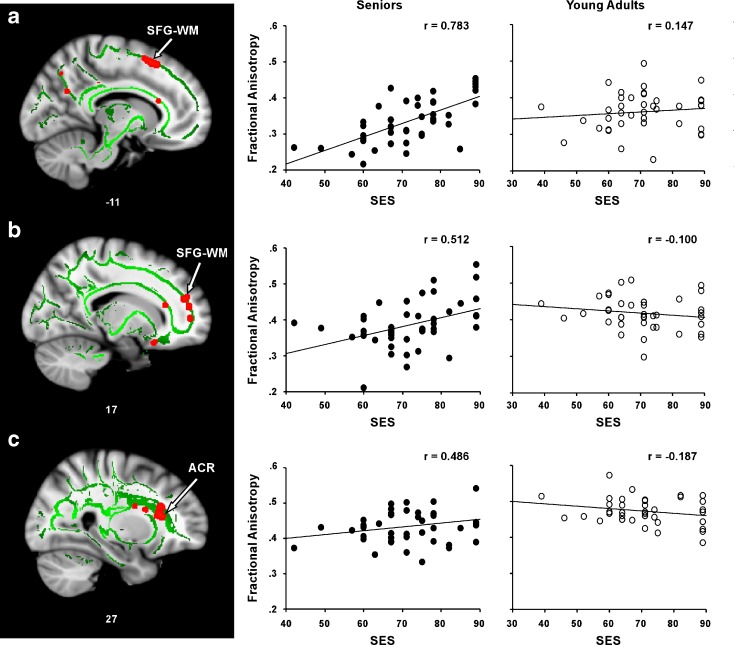
Fig. 2.
SES is correlated with FA in seniors. A positive correlation between SES and FA in the senior group was observed in a WM underlying the left superior frontal gyrus (SFG–WM), b WM underlying the right superior frontal gyrus SFG–WM, and c the right anterior coronal radiata (ACR). The numbers below each slice represent x coordinates in MNI space. The right panel shows scatter plots of the correlations between mean FA and SES in each WM region for each group (seniors = filled circles; young adults = open circles). Note: To render FA–SES regression plots more interpretable, participants’ SES values on the ISP were converted such that higher scores now reflected higher levels of SES (by subtracting each participant’s score from 100)

