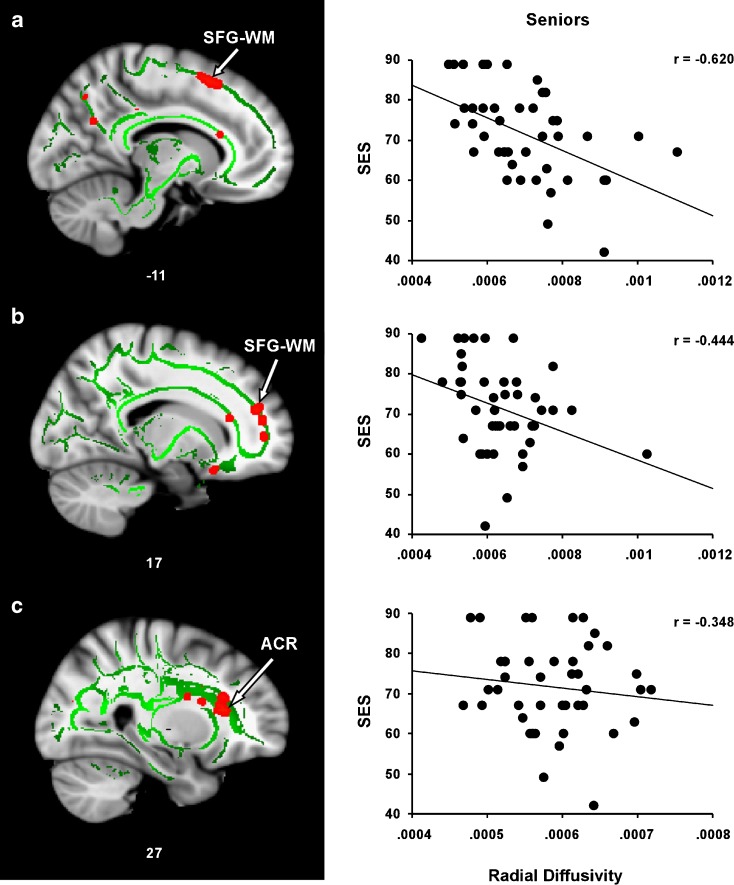
Fig. 3.
Relationship between SES and DR in regions showing a positive SES–FA correlation in seniors. Regression plots show the negative relationship between SES and DR in a WM underlying the left superior frontal gyrus (SFG–WM), b WM underlying the right superior frontal gyrus SFG–WM, and c the right anterior coronal radiata (ACR)

