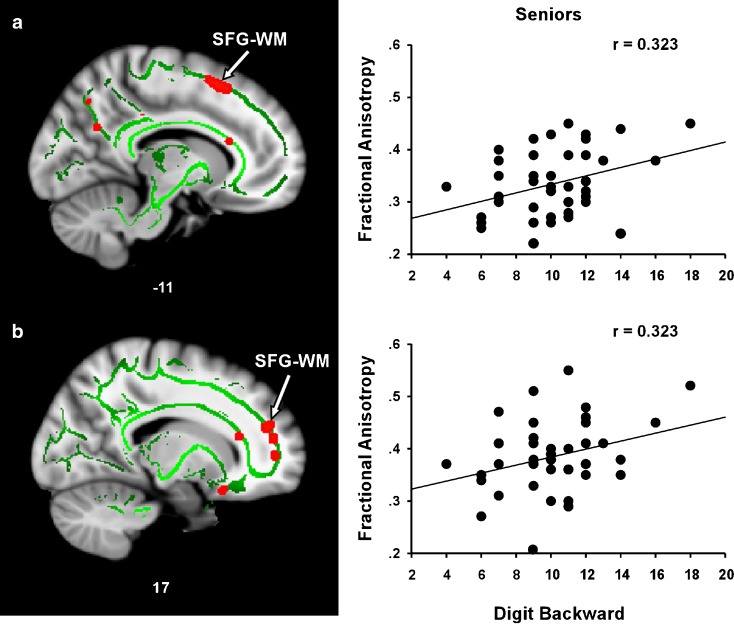
Fig. 4.
Relationship between FA and working memory (digit backward) in regions showing a positive SES–FA correlation in seniors. The left (a) and right (b) SFG–WM regions showing a positive correlation between SES and FA also showed a positive FA–DB correlation. The right panel shows scatter plots of the correlations between mean FA and DB

