Fig. 3.
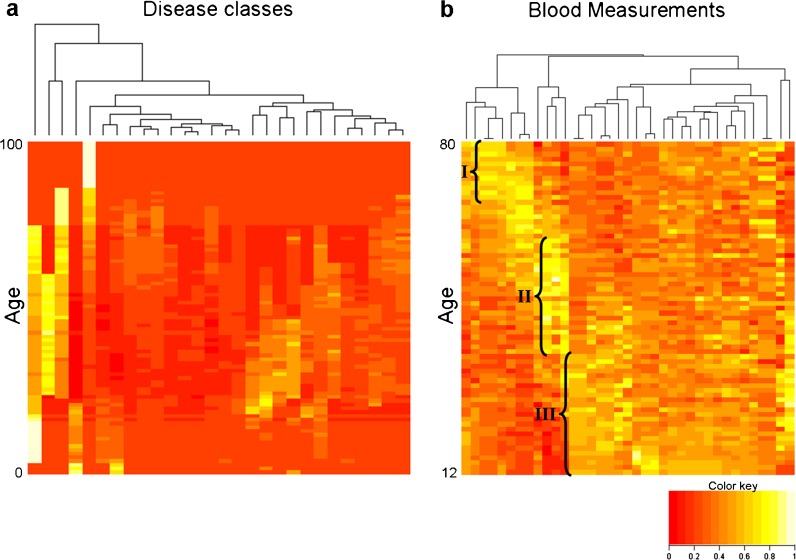
Age-related changes in clinical parameters. a The distribution of APK values across 28 disease classes. For each disease class (columns), the median values of instances across all the diseases in that class and that age are shown. b Heat-map of the number of patients with abnormal values per age and blood measurement (ages range from 12 to 80 years). This heat-map was generated using data from the NHANES survey (2007–2010)

