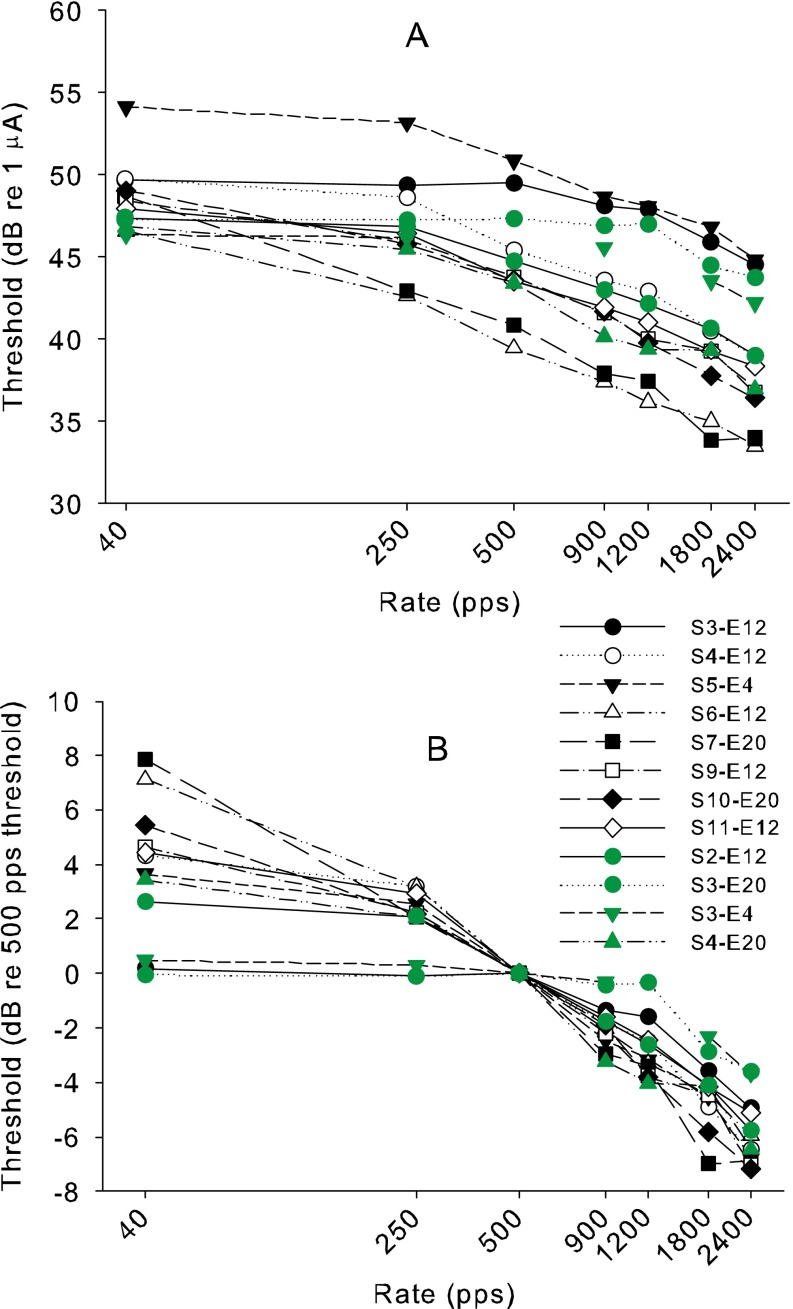
FIG. 2.
A The behavioral thresholds of each subject in decibel re 1 mA as a function of stimulus rate. B The behavioral thresholds replotted in decibel re the 500-pps threshold. In both plots, the green data are additional behavioral data sets that were not used later for comparison with ECAP data (including a set for S2 who was later removed from the study due to inadequate ECAPs). The additional data are included to better illustrate the variability in slopes among subjects and electrodes.

