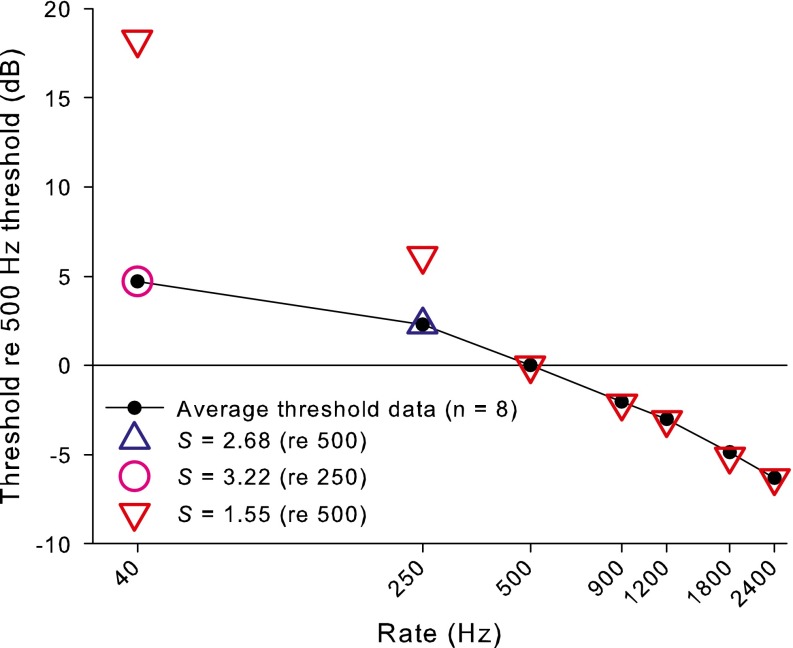
FIG. 8.
Mean behavioral thresholds (solid circles and line) and model fits to the data (colored open symbols) for different rates plotted as a function of the 500-pps threshold. The open symbols are model fits to the data using the measured values of A and using S as a fitting parameter. A constant S of 1.55 (red downward triangles) produces an excellent fit for all data points above 500 pps, but fails to predict the shallower slope below 500 pps. Increasing values of S at higher levels (blue upward triangle and pink circle) are needed to fit the behavioral data.

